Higher yields may keep USD support for longer

Headlines
* BoC surprises with 25bp rate hike and hints at more to come
* Fed hike by July now fully priced in as US yields climb
* Dollar steady as traders consider Fed, global rates outlook
* Tech sell-off drags stocks lower amid upward rates pressure
FX: USD continues to track sideways around 104 on the DXY. The 2-year yield jumped up above towards 4.6% The 10-year yield is rebounded strongly off the 200-day SMA at 3.66%. It settled near its high at 3.79%. The May cycle high is at 3.85%.
EUR closed little changed at 1.0697. Recent commentary from ECB officials continues to suggest further rate hikes ahead. GBP printed a high at 1.2499 before finishing at 1.2437. USD/JPY traded in a 139/140.24 range before closing at 140.11. Firmer GDP revisions helped the pullback from yield-driven gains. AUD popped up to a high of 0.6717 before closing below its 200-day SMA and near the lows of the day at 0.6651. The indecisive risk tone and softer Australian trade data didn’t help. USD/CAD dropped to a low of 1.3320 after the BoC’s surprises rate hike. It settled below near-term trendline resistance at 1.3368.
Stocks: US equities were mixed with notable weakness in tech megacaps. The tech-laden Nasdaq lost 1.75%. The benchmark S&P 500 closed lower by 0.38% at 4267. The Dow outperformed, finishing 0.27% higher. The Russell 2000 rose to its highest level since the US regional banking crisis in March, before slipping 0.3%. The small cap index has risen nearly 8% since the end of May. It has outperformed the S&P 500 and Nasdaq over the same period. They have both risen 2%.
Asian stocks were muted fowling the mixed finish Stateside. Tech underperformed as global yields climbed. The Nikkei 225 retreated under the 32,000 level despite upward Japan Q1 GDP revisions. The Hang Seng were subdued amid ongoing concerns about the world’s second largest economy.
US equity futures are pointing to a lower open with the Nasdaq 100 off 0.42%. European equity futures are indicating a lower open (-0.5%). The Euro Stoxx 50 closed down 0.1% yesterday.
Gold struggled as yields went higher. It is currently trading just above the 100-day SMA at $1940. This has acted as good support over the last few weeks and previously in March. The halfway point of this year’s rally form March is $1935.
Event Takeaway – Central bank’s work not yet done
Yesterday saw the second surprise hike by a major central bank this week. We thought central bankers were not meant to rock the boat and stoke uncertainty. Certainly, that is meant to be the case in this era of forward guidance, albeit with more data dependence currently. But the reaction function is now confused as the BoC followed the RBA by hiking rates while consensus expected no change.
A second leg of the policy normalisation cycle after a premature pause is upon us. Policy is not sufficiently restrictive enough to balance up supply and demand and return inflation back to target. This was the first hike by the BoC since January and markets have priced in another next month. The implications are obvious for the Fed. The FOMC will have to remain hawkish and that will keep the dollar bid through the summer. “Higher for longer” is the theme. (Though that did cause a blow-up in March!)
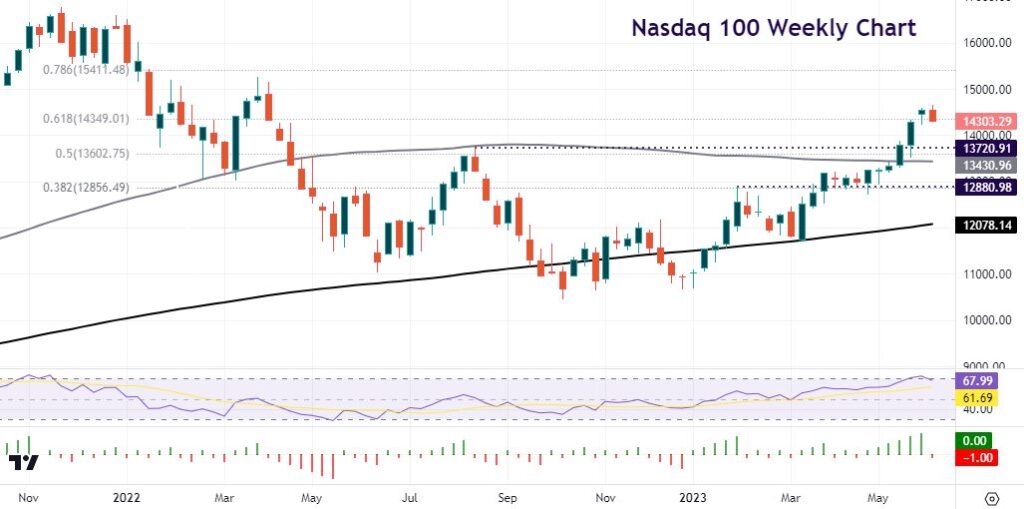
Chart of the Day – Nasdaq turns
We’ve been talking about the narrow breadth and leadership in stock markets for some time in our weekly webinars. As of late last week, the five largest companies made up nearly a quarter of the S&P 500. The benchmark stock index was up over 12% year-to-date recently, but the equal weighted index had gained only 1.5%. Rotation is now being seen into some small caps as witnessed by the recent outperformance of the Russell 2000. Energy, real estate and industrials led the way yesterday. New sectors leading is a good signal for the strength of the bull market.
But rising yields is generally not good for tech companies and growth stocks. These businesses tend to have high valuations based on future profits. But higher rates mean that earnings years from now are worth less today. Regarding the Nasdaq 100, there’s a big Fib level (61.8%) of the 2022 sell-off at 14,349. Below here is the August 2022 top at 13,720.

The information has been prepared as of the date published and is subject to change thereafter. The information is provided for educational purposes only and doesn't take into account your personal objectives, financial circumstances, or needs. It does not constitute investment advice. We encourage you to seek independent advice if necessary. The information has not been prepared in accordance with legal requirements designed to promote the independence of investment research. No representation or warranty is given as to the accuracy or completeness of any information contained within. This material may contain historical or past performance figures and should not be relied on. Furthermore estimates, forward-looking statements, and forecasts cannot be guaranteed. The information on this site and the products and services offered are not intended for distribution to any person in any country or jurisdiction where such distribution or use would be contrary to local law or regulation.
