Eyes on heavyweight earnings ahead of central bank meetings

Headlines
* BoJ to stick with easing as markets see clock ticking on YCC
* Euro staggers with trades wary of hawkish ECB, dollar gains
* Alphabet, Microsoft and LVMH all report earnings after the closes
* Asia stocks gain as investors cheer China’s Politburo message
FX: USD advanced for a fifth straight day. This win streak was last seen at the end of May. The DXY remains above the 101 handle. The 50-day SMA is at 101.66. The 2-year yield pushed up above 4.90%. But it is lower today with the 50-day SMA acting as support at 4.84%. The 10-year yield is climbing towards 3.90%.
EUR lost another 0.55% and sunk below 1.11. PMIs were disappointing with the German manufacturing dropping to 38.8, it lowest since May 2020.
GBP fell again for a seventh straight day. Yesterday’s low fell below the 50-day SMA at 1.2849. Buyers are trying to cling to the June top at 1.2848. July PMI data was weaker than June’s and well below estimates. Market confidence in a 50bp August hike continues to drift. There are around 33bps priced in currently. This is down from 45bp at the start of July, and 36bp late last week.
USD/JPY snapped its six-day win streak. But itis consolidating its recent gains above 141. The 50-day SMA is above at 141.72. The low 11 days ago was 137.23. Rising US Treasury yields have helped. Speculation around an unchanged BoJ policy meeting has been the big kicker.
AUD came off session highs but has bounced from its 50-day and 200-day SMAs at 0.6721/22. USD/CAD upside was again capped by the 50-day SMA at 1.3218. The July low is at 1.3092.
Stocks: US equities ended higher to kick off a packed week of earnings and risk events. It was a choppy session as investors digested weak Eurozone and UK data which was mixed in the US. The benchmark S&P 500 rose 0.4% to 4554. The tech-dominated Nasdaq added 0.14%. The Dow mildly outperformed, gaining 0.52% led by financials and energy stocks. That marked its eleventh consecutive winning session. It touched its highest level since April 2022 and highest close since February 2022.
Asian stocks were mostly higher. Chinese stocks were boosted after the Politburo’s support pledges. Gains were led by a surge in tech and property stocks. The Nikkei 225 lagged. New source reports noted the BoJ is considering a big increase in its 2023 inflation outlook.
US equity futures are marginally higher. European equity futures are pointing to a softer open. The Euro Stoxx 50 closed off 0.2% yesterday.
Gold dropped for a fourth day in a row yesterday. But buyers have erased some of yesterday’s loss this morning. A softer greenback has helped. A Fib level (38.2%) of the May decline sits at $1959. The midway point is at $1980.
Day Ahead – IFO and earnings in the spotlight
Markets will check today’s German business sentiment survey this morning. This comes after depressing PMI data out of the Eurozone yesterday hit EUR. The manufacturing numbers were shockingly poor. The composite PMI fell to an eight-month low of 48.9. That was the second straight month of sub-50 readings. This points to the current “slowcession”, as some economists are calling it, not ending any time soon. Key support in EUR/USD remains at 1.1032.
There’s a busy menu of major megacap stocks reporting today. Luxury goods giant LVMH releases earnings after the European close. Focus will be on the possible US growth slowdown and China strength. The tech titans, Microsoft and Alphabet report after the US close.
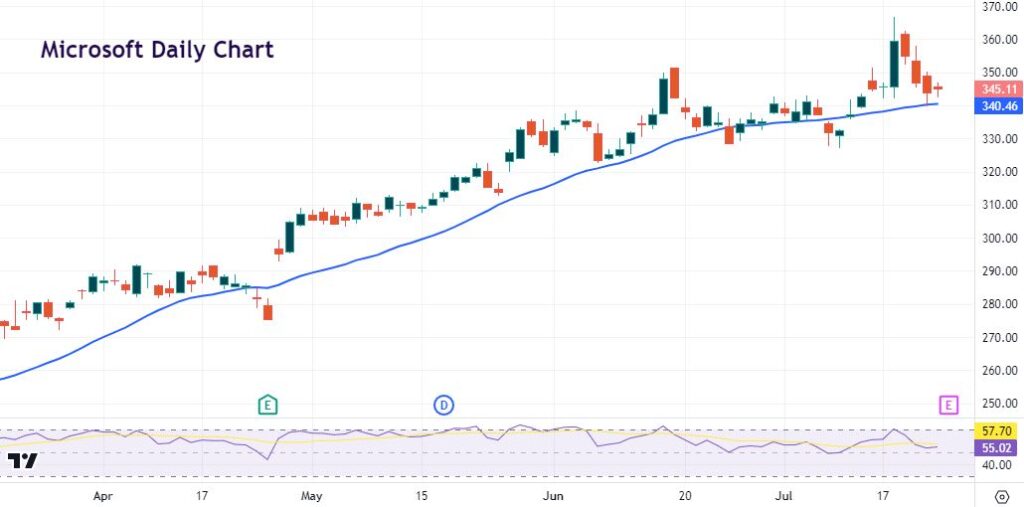
Chart of the Day – Microsoft backs off all-time highs
The next major tech giants report later today with Alphabet and Microsoft on tap. Investors will zero in on the degree to which competition from AI-driven rivals is eating into Alphabet’s core search business. Last quarter also saw falling revenue from YouTube ads y/y for the first time ever.
MSFT’s shares popped to a record high last week. This was after the company announced the pricing plan for new AI features on its Office products. Top line growth is forecast to remain below 10%. There is concern over cloud service growth. Prices have fallen back to the 50-day SMA at $340.46. This has been good support since spring time. Last week’s high to beat is $366.78. We note the possible bearish weekly shooting star pattern. The July low sits at $327.

The information has been prepared as of the date published and is subject to change thereafter. The information is provided for educational purposes only and doesn't take into account your personal objectives, financial circumstances, or needs. It does not constitute investment advice. We encourage you to seek independent advice if necessary. The information has not been prepared in accordance with legal requirements designed to promote the independence of investment research. No representation or warranty is given as to the accuracy or completeness of any information contained within. This material may contain historical or past performance figures and should not be relied on. Furthermore estimates, forward-looking statements, and forecasts cannot be guaranteed. The information on this site and the products and services offered are not intended for distribution to any person in any country or jurisdiction where such distribution or use would be contrary to local law or regulation.
