Stocks hot streak continues, Bitcoin hits a record high

Overnight Headlines
*US stocks were little changed but posted more record highs
*USD fell slightly with focus on the infrastructure bill
*US 10-year Treasury yields were supported by 200-day SMA
US equities had modest gains driven mainly by cyclical companies. The S&P500 and Nasdaq extended their run of all-time closing highs to eight straights sessions. Travel names outperformed as the US opened up for international travel. Asian shares are mixed with China down on lingering worries about the real estate sector’s liquidity woes. European markets are set for a softer open. US futures are also in the red.
USD dipped and is trading below 94 on the DXY. This has seen EUR move up to 1.16 and resistance. GBP also faces a barrier above at the July low at 1.3571. USD/JPY broke through the recent trading range and support at 113.25. Various Fed speakers gave hints about the monetary policy outlook but failed to generate much volatility.
Market Thoughts – Fed speakers in quiet markets
There is not too much on the calendar to get excited about today. Markets are a little bit messy which can often be the way after so much news to digest in the last few weeks. As we mentioned yesterday, the main drivers for any direction and clarity are coming from central bank speakers.
US Treasury market yields have bounced slightly but are still trading below 1.5%. The Fed is desperately trying not to spook the markets. In turn, it is endeavouring to shift to a more credible rate guidance stance. The market still has two rate hikes priced in for next year. This position was validated by Fed official Bullard yesterday. But known Fed dove Evans remains in the 2023 lift off camp, even if admitting he sees inflationary pressures building more steeply.
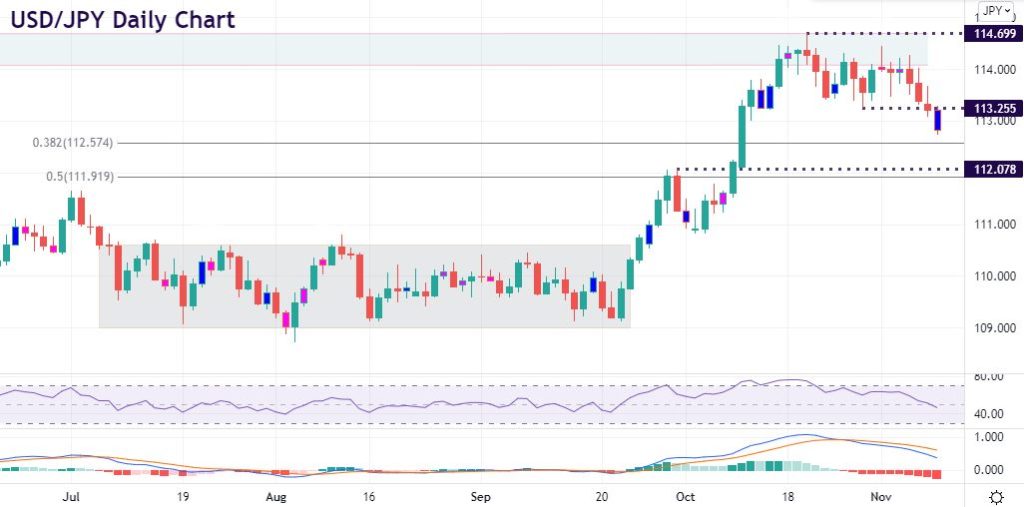
Chart of the Day – USD/JPY breaks down
This major has been consolidating in a range around 114 recently. But we have may seen the top at 114.69 after falling below the bottom of the recent range this morning at 113.25. A major resistance zone lies above 114 with long-term highs around 114.55/69.
A strong close below 113.25 could see a deeper sell-off to 112.57. This is the 38.2% Fib retracement level of the September to October move. The late September high sits at 112.07. The midpoint of the recent move higher is just below at 111.91.
The information has been prepared as of the date published and is subject to change thereafter. The information is provided for educational purposes only and doesn't take into account your personal objectives, financial circumstances, or needs. It does not constitute investment advice. We encourage you to seek independent advice if necessary. The information has not been prepared in accordance with legal requirements designed to promote the independence of investment research. No representation or warranty is given as to the accuracy or completeness of any information contained within. This material may contain historical or past performance figures and should not be relied on. Furthermore estimates, forward-looking statements, and forecasts cannot be guaranteed. The information on this site and the products and services offered are not intended for distribution to any person in any country or jurisdiction where such distribution or use would be contrary to local law or regulation.
