Risk mood on the up, yen suffering

Overnight Headlines
*US stocks jumped as better-than-expected outlooks kicked off earnings
*USD ended lower against most G10 peers
*Gold is holding recent gains around $1800 resistance
*Oil continues higher, nears October 2018 high at $86.71
US equities rose with risk appetite returning in full flow. The S&P500 and Nasdaq both surged 1.7% with the former just 2% from its record highs. The inflation trade reversed with tech and materials leading the way. The Vix has fallen below 17, the lowest level since September. Solid gains are seen in Asia and futures are green.
USD saw profit-taking for a second day following a drop in bond yields. But buyers did step in to take the DXY back to 94. EUR is trading right on resistance at 1.1604, GBP couldn’t sustain gains beyond 1.37. EUR/GBP dipped close to support at 0.8450 before bouncing. USD/CAD remains offered, hitting lows of 1.2350 this morning, last seen in July. USD/JPY has taken off again, breaking higher towards a zone of resistance around 114.50.
Market Thoughts – Yen pairs to the moon…
We have US retail sales to engage us this afternoon. Analysts expect a rise in core sales in September after the flat print in August. Plunging vehicle sale sand rotation into services are weighing on sales. If we see a worse number, worries around bottle necks and so inflation pressures will increase.
The major FX news is the continued hammering of the yen. Rebounding risk sentiment and rate tightening expectations are helping yen pairs higher. That said, long US yields are still pretty anchored and below recent highs, which is causing some head scratching here!
USD/JPY now trades above 114, GBP/JPY is flirting with a break above this year’s highs at 156.08. NZD/JPY has made fresh yearly highs and CAD/JPY is extending its breakout to peaks last seen in November 2015. It’s all about the technicals here as we move into severe overextension. This ordinarily means a pullback soon in some form.
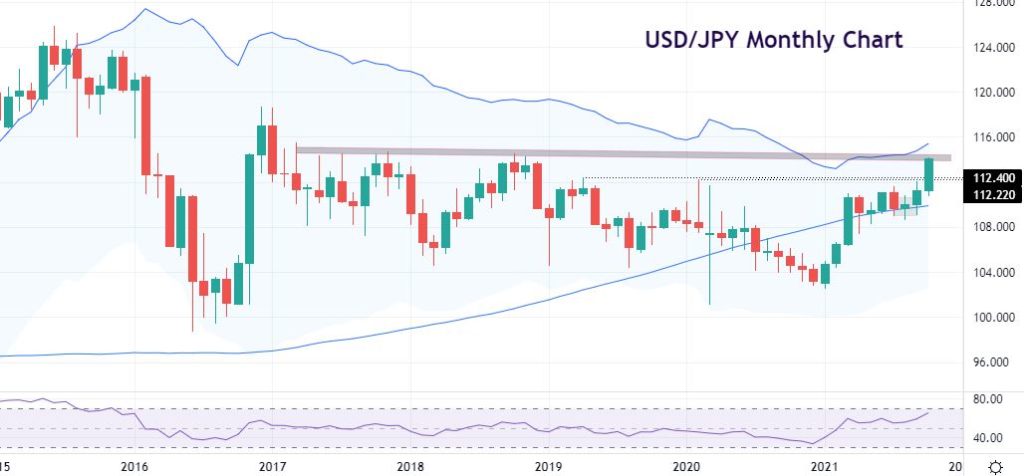
Chart of the Day – USD/JPY monthly chart highlights next resistance zone
Having written about USD/JPY this time last week, the pair has rocketed higher with moves not seen since 2018. The improved risk mood never helps the yen and booming commodity and energy prices weigh on Japan which is a heavy energy importer.
After breaking 2020 and 2019 highs at 112.22 and 112.40 respectively, we can see a major resistance zone in 2017 and 2018 around 114.36 to 114.74. The daily and weekly RSIs are in overbought territory and through the upper Keltner channels. But the monthlies still potentially have more to go. The next long-term resistance area is at 118.61/66 while support is 113 and then 112.40.
The information has been prepared as of the date published and is subject to change thereafter. The information is provided for educational purposes only and doesn't take into account your personal objectives, financial circumstances, or needs. It does not constitute investment advice. We encourage you to seek independent advice if necessary. The information has not been prepared in accordance with legal requirements designed to promote the independence of investment research. No representation or warranty is given as to the accuracy or completeness of any information contained within. This material may contain historical or past performance figures and should not be relied on. Furthermore estimates, forward-looking statements, and forecasts cannot be guaranteed. The information on this site and the products and services offered are not intended for distribution to any person in any country or jurisdiction where such distribution or use would be contrary to local law or regulation.
