725k median NFP print expected

Overnight Headlines
*USD extended losses as possible sub-par NFP looms
*US stocks rose but tech underperformed
*Oil prices rebounded to near one-month highs
USD continues to struggle, down nine days in the past eleven. This comes despite the weekly jobless claims hitting a fresh pandemic low. EUR is now up for a sixth day in a row, with just one down day in eleven. EUR/USD is now approaching the end of July highs at 1.1908. GBP has just broken trendline resistance from the June high. Yesterday saw cable push up through the 200-day SMA at 1.3806. AUD and NZD continued higher, the aussie now touching last month’s highs at 0.7425. The kiwi is trading at levels last seen in mid-June.
US equities closed in the green with small caps and energy the best sectors. Tech was the laggard for once though the Nasdaq closed marginally higher up 0.1%. Asian markets are mixed this morning. Japan rose nearly 2% before pulling back on news of PM Suga’s resignation. Futures in Europe and the US are pointing to small gains.
Market Thoughts – Dollar sell-off too much?
The lottery of the monthly NFP report is upon us. It’s tough to predict at the best of times, and this was especially true during the heat of the pandemic. The spread of forecasts is wide at around 400k to 1mln for the headline print – pretty standard over the last 18 months. But the outcome will be highly significant due to the Fed’s data dependency and the start of tapering in the balance.
The dollar sell-off has been quite dramatic this week so the bar may be low for a corrective pullback. The so-called “whisper” number may be lower than the current 725k median estimate. This is due to the rank ADP figure and the PMI employment component contracting this week. So higher than 900k means a possible (early) taper, lifting USD and weighing on stocks. A bit lower than the median and equities should enjoy the reduced taper chances and the dollar will drift. A very disappointing report may see USD do well. But stock markets would take the brunt of the disappointment with (real) bond yields sinking.
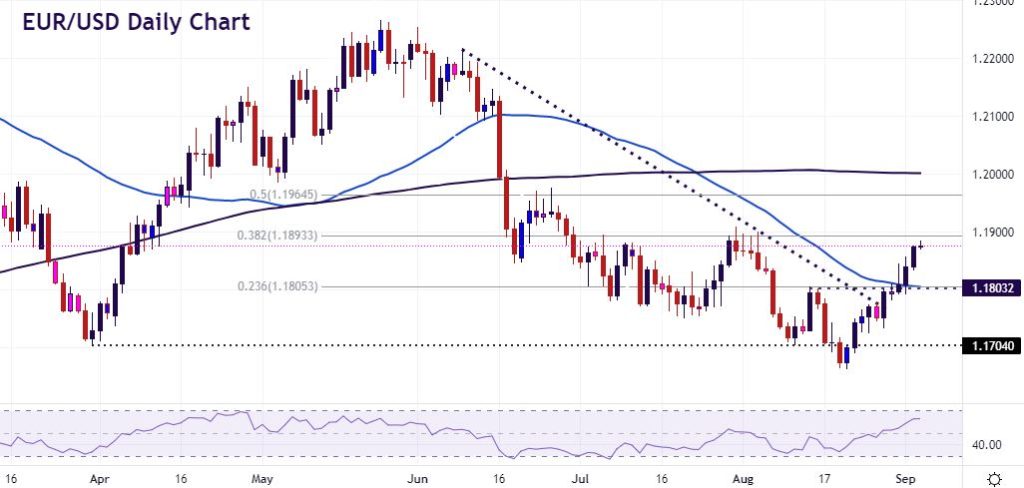
Chart of the Day – EUR/USD up to the recent highs
With the ECB hawks squawking loud this week and the dollar in the dumps, EUR/USD is enjoying a winning run not seen since July last year. This bullish streak has broken the June-August downtrend as well as near-term resistance around 1.18. The 50-day SMA at 1.1807 should reinforce this level of support now.
Bulls have their eyes on the 1.1895/1.1905 zone. This marks the recent high in July and the 38.2% Fib retracement level of the June-August decline at 1.1894. We are not overbought on momentum indicators so there is room for more upside. All eyes are on the release at 13.30BST. Obviously, volatility is expected to be high and note it’s a US holiday on Monday.
The information has been prepared as of the date published and is subject to change thereafter. The information is provided for educational purposes only and doesn't take into account your personal objectives, financial circumstances, or needs. It does not constitute investment advice. We encourage you to seek independent advice if necessary. The information has not been prepared in accordance with legal requirements designed to promote the independence of investment research. No representation or warranty is given as to the accuracy or completeness of any information contained within. This material may contain historical or past performance figures and should not be relied on. Furthermore estimates, forward-looking statements, and forecasts cannot be guaranteed. The information on this site and the products and services offered are not intended for distribution to any person in any country or jurisdiction where such distribution or use would be contrary to local law or regulation.
