Yen stable as Ueda supports current BoJ stance

Headlines
* Ueda backs BoJ easing for now, normalisation if price goal reached
* Japanese inflation hits 41-year high, holding BoJ under pressure
* US Q4 growth appeared strong but underlying details remain soft
* Dollar steady on higher-for-longer rates outlook, yen steady
FX: USD made a fresh high of 104.77, finally beating last week’s spike top. DXY is enjoying its fourth straight day of gains, not seen since October. The index is also heading for its fourth positive week in a row. This was last seen in May. The benchmark US Treasury 10-year yield slipped off its recent highs. It touched 3.97% yesterday, a level last posted in November. The closely watched part of the US Treasury yield curve measuring the gap between yields on the 2-year and 10-year deepened its inversion to nearly 82bps.
EUR dipped to 1.0577 before rebounding but closing below 1.06. GBP is trying to hold above 1.20 as it remains relatively contained. USD/JPY was choppy as markets digest the commentary from BoJ nominee Ueda. AUD trades around its 200-day SMA now at 0.6799. USD/CAD is consolidating its recent push north. Bulls are supported by the 50-day SMA at 1.3508 and falling trendline support.
Stocks: US equities eventually finished higher after reversing an early sell-off. The benchmark S&P 500 closed +0.53% higher and above 4,000. The 50-day SMA at 3,980 is acting as support. The tech-laden Nasdaq 100 advanced 0.94% higher. The Dow edged up 0.33%. Nvidia surged 14% and hit a six-month high after its Q4 results beat analyst estimates. The giant US chipmaker signalled its intentions to push further into the artificial intelligence space.
Asian stocks traded mostly rangebound. The Nikkei 225 outperformed after comments from BoJ Governor nominee Ueda noted that current monetary policy is appropriate. He said Japan needs more time for inflation to sustainably hit its 2% target. The Hang Seng was lower after a big liquidity drain by the PBoC and tech losses due to softer earnings.
US equity futures are in the red led by Nasdaq futures (-0.35%). European equity futures are pointing to a higher open. (+0.4%)
Gold made a new cycle low at $1817. But the precious metal has steadied this morning as traders await the US PCE data.
Day Ahead – More bullish US data in the offing
We get more US economic figures out today which are expected to be strong, similar to all the other recent data. Some economists are questioning if this strength is due more to the unseasonable warmer weather rather than any significant show of resilience in the US economy. That means policymakers may want to see more data for February and beyond. The PCE inflation numbers are likely to add more fuel for dollar bulls.
Yesterday saw slightly more mixed data releases including a weaker second GDP reading for Q4. But that included hot inflation metrics. There was also a fall in jobless claims which printed under 200,000 for the sixth consecutive week. This is a sign of continued labour market tightness and adds to the Fed’ hawkish bias.
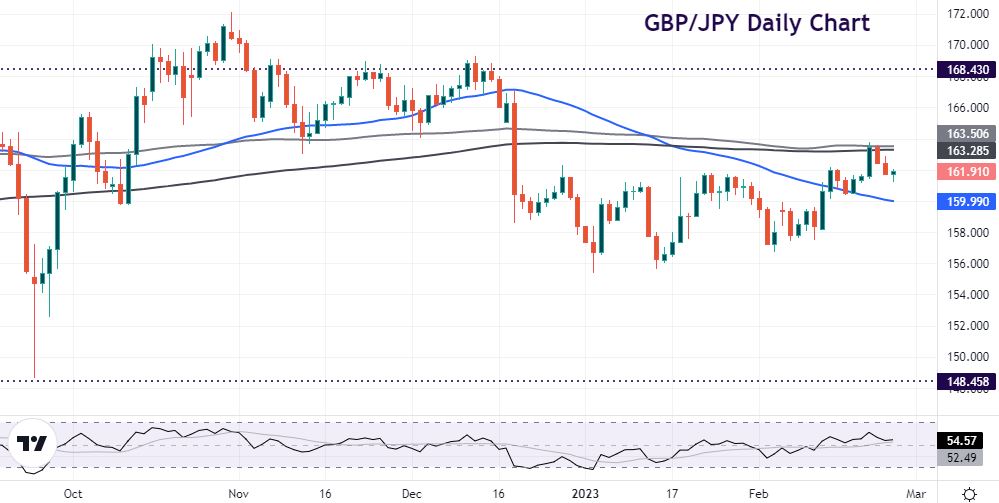
Chart of the Day – GBP/JPY rolls over
All eyes were on the new proposed Governor of the BoJ overnight. In his first public address, he was pragmatic and relatively cautious. He said it is appropriate to continue monetary policy easing for now. If trend inflation improves significantly, the bank needs to move towards policy normalisation. But if it does not, it must consider ways to maintain YCC. Right on cue, Japan’s CPI hit a four-decade high. But this was in line with estimates. Current Governor Kuroda still thinks inflationary pressures will fade.
Upside in GBP/JPY has been capped by both the 100- and 200-day SMA at 163.50 and 163.28. The chart is a bit messy at the moment. Support may be seen at the January highs around 161.68. the 50-day SMA is below here at 159.98.

The information has been prepared as of the date published and is subject to change thereafter. The information is provided for educational purposes only and doesn't take into account your personal objectives, financial circumstances, or needs. It does not constitute investment advice. We encourage you to seek independent advice if necessary. The information has not been prepared in accordance with legal requirements designed to promote the independence of investment research. No representation or warranty is given as to the accuracy or completeness of any information contained within. This material may contain historical or past performance figures and should not be relied on. Furthermore estimates, forward-looking statements, and forecasts cannot be guaranteed. The information on this site and the products and services offered are not intended for distribution to any person in any country or jurisdiction where such distribution or use would be contrary to local law or regulation.
