Stocks and gold bounce, US non-farms ahead

Headlines
*US job growth seen smallest in two years, unemployment rate to tick up
*RBA cuts growth outlook, rates need to rise to cool red hot inflation
*USD ascendant, GBP slumps on lower rate expectations, bleak outlook
*Tech, reopening stocks lead best China weekly rally in years
FX: USD moved higher after recouping early losses. The DXY got above 113 before closing around 112.93 and has sold off this morning. The 21-day SMA sits below at 112.12 and offers first support. US 10-year Treasury yields spiked to 4.22% but currently trade at 4.16% ahead of NFP. The yield curve reached new extremes of inversion trading at levels not seen since the early 1980s. Curve inversions have a great track record of preceding recessions.
EUR/USD closed at its lowest level in about a month with four straight days of losses. GBP/USD tumbled on a dovish BoE closing lower by over 2% at 1.1159. It found support at a Fib level (23.6%) of this years’ fall at 1.1157. USD/JPY traded in a narrow range and sits above the 21-day SMA at 147.78.
AUD/USD fell for a sixth day in a row but has found a bid today. It is challenging the September low at 0.6363. USD/CAD popped higher above 1.38 yesterday but has fallen back towards 1.3682. We get Canada jobs data out today. Gold fell to $1616 and major support before rebounding this morning. It remains below the 21-day SMA at $1652.
Stocks: US equities dropped for a fourth consecutive session. The Dow looks likely to end four weeks of gains, closing lower by-0.46%. The broad-based S&P 500 fell -1.06% and the Nasdaq again fared the worst losing -1.98%. Both indices seem poised to break two-week winning streaks. Fears of central bank tightening and higher yields hurt tech and cyclical growth stocks. This sector also reported weak earnings recently.
Asian stocks are mixed. The Nikkei 225 was hit on a return from holiday and has reacted to the hawkish Fed meeting. But Chinese stocks have rallied strongly on unverified reopening rumours. There is also speculation that authorities are exploring an exit from the zero-covid policy.
S&P 500 futures are modestly in the green. European equity futures are higher overnight after cash markets closed down 0.8% yesterday.
Event Takeaway – BoE signals dovish outlook
The BoE hiked rates by an unprecedented 75bps taking the Bank Rate to 3%. But in contrast to the Fed who pointed to a higher peak rate, the MPC was at pains to say the UK’s terminal rate will be lower than the market expects (4.5%-4.75%). Both the policy statement and new forecasts explicitly signalled a grim outlook. The bank is forecasting a deep recession regardless of whether it hikes rates any further.
This all combined to smash the pound which gave up support from the 50-day SMA at 1.1332. More hikes are expected as Governor Bailey highlighted there should be an upward tilt to the inflation forecasts. It is an extremely tough spot for policymakers which tells us sterling will continue to struggle in the current environment. GDP data next week is likely to confirm the ugly situation.
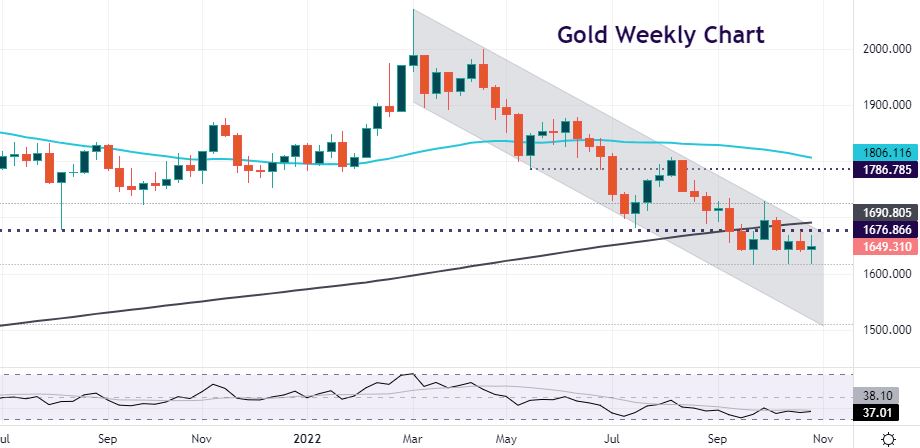
Chart of the Day – Gold wallows near the lows
Gold reacted sharply to the hawkish Fed midweek after initially finding a bid on the statement pivot. The yellow metal eventually slumped 2% from the high and made a new cycle low. This morning is seeing a bounce again from a support zone. The further inversion of the yield curve signals major risks of an economic slowdown.
Solid job gains are expected in today’s NFP report, even though the pace of those is slowing. That means we’ve not yet reached peak hawkishness and should see longer support for the dollar and Treasury yields, that should see gold continue to stumble. Key support is around $1614/17. We’ve touched this zone three times and rebounded. Strong resistance sits around a $1676 area.
The information has been prepared as of the date published and is subject to change thereafter. The information is provided for educational purposes only and doesn't take into account your personal objectives, financial circumstances, or needs. It does not constitute investment advice. We encourage you to seek independent advice if necessary. The information has not been prepared in accordance with legal requirements designed to promote the independence of investment research. No representation or warranty is given as to the accuracy or completeness of any information contained within. This material may contain historical or past performance figures and should not be relied on. Furthermore estimates, forward-looking statements, and forecasts cannot be guaranteed. The information on this site and the products and services offered are not intended for distribution to any person in any country or jurisdiction where such distribution or use would be contrary to local law or regulation.
