Futures point to flat open to finish volatile week

*Fed’s Daly sees half-point September hike, but no inflation victory
*UK GDP shows worst economic downturn since 2021 lockdowns
*Oil prices slip on cloudy demand outlook, but poised for weekly gains
*Asia shares mixed, Japan stocks outperforming as US yields dip
US equities closed mixed amid the weaker-than-expected US PPI prints. The Nasdaq lost 0.65% and the S&P 500 finished marginally lower. A 2.6% rally in crude saw energy stocks make the biggest gains. US Treasury yields rose led by the 30-year. It climbed to its highest level in several weeks. Asian markets are in the green with Indian shares on track for a fourth week of gains. US futures are indicating a flat open.
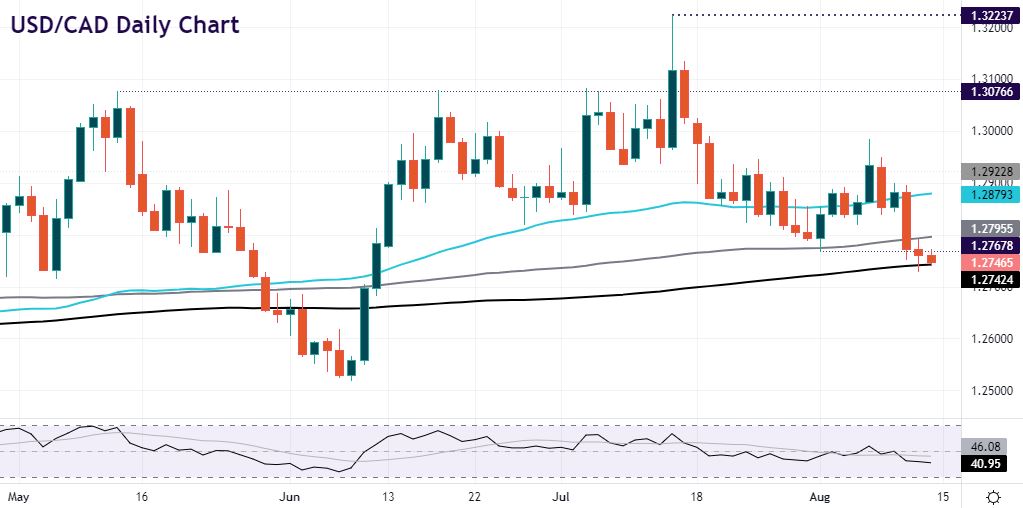
USD continued to lose ground against its peers. Softer input price data added to the midweek miss on the all-important US consumer price figures. DXY saw lows of 104.65 before closing just above 105. EUR again pushed above the 50-day SMA and tested the 1.0350-60 region without manging a clean break. GBP closed largely unchanged. USD/JPY made another dip below 132 before rebounding above 133. AUD made another new high above 0.71. USD/CAD has fallen to its 200-day SMA at 1.2742.
Event Takeaway – More good news about falling prices
We got fresh data, whisper it quietly, that the worst of inflation might be over. Producer prices are a gauge of final-demand wholesale prices. They have surged thanks to the energy price surge and supply chain issues. One of its measures, the final demand basis, hit an all-time high earlier this year. But the July PPI dipped into negative territory, coming in at -0.5% m/m. This was much cooler than the 1% print last month and the +0.2% expected. The annual increase was the lowest since October 2021 and the monthly move was the first decline since April 2020.
Cooling prices paid by producers signal a further cooling for consumer prices. That’s because producer prices are further up the inflation pipelines. As supply chains improve, end consumer prices should ease further. This week’s data has given reason for the Fed to potentially dial back jumbo-sized rate increases. The dollar has broken trendline support and today’s close, to finish the week will be key. We get the Michigan consumer survey released later today. Expectations are for a modest improvement given lower gasoline prices.
Chart of the Day – USD/CAD hits the 200-day SMA
The loonie has been a relative underperformer recently. Markets have trimmed rate hike bets from the Bank of Canada ahead of CPI data next week. This assumes that it could show a similar peak and fall like the US data has done. Still, pricing for a hike at its September meeting remains elevated with around 60bps discounted.
At least firmer crude, stronger stocks and lower volatility are all helping CAD currently. Wednesday’s plunge in USD/CAD saw it break down through support. This included the August low at 1.2767 and the 100-day SMA at 1.2795. Prices are now sitting on the 200-day SMA at 1.2742. A sustained drop below here sees 1.27 and 1.2554 as targets. Initial resistance is the 100-day SMA around 1.28 and then 1.2850.

The information has been prepared as of the date published and is subject to change thereafter. The information is provided for educational purposes only and doesn't take into account your personal objectives, financial circumstances, or needs. It does not constitute investment advice. We encourage you to seek independent advice if necessary. The information has not been prepared in accordance with legal requirements designed to promote the independence of investment research. No representation or warranty is given as to the accuracy or completeness of any information contained within. This material may contain historical or past performance figures and should not be relied on. Furthermore estimates, forward-looking statements, and forecasts cannot be guaranteed. The information on this site and the products and services offered are not intended for distribution to any person in any country or jurisdiction where such distribution or use would be contrary to local law or regulation.
