Euro at important technical juncture, UK CPI hits 11.1%

Headlines
*Markets jolted by strike in Poland, confusion over who fired missile
*Currencies on edge as traders assess risks from Ukraine/Polish border
* UK CPI came in stronger at 11.1% vs 10.7% expected, core 6.5% vs 6.4%
*Gold firms on Fed slowdown as investors eye geopolitical situation
FX: USD fell sharply before regaining some of its losses to finish 0.3% lower. The DXY had dipped below support at 105.78 before safe haven buyers stepped in on the Poland issue. US Treasury yields fell again after the release of the weaker than expected PPI data. The 10-year US Treasury dropped below support at 3.84%.
EUR/USD hit a peak of 1.0481 but pulled back below 1.04. GBP/USD made a new high at 1.2028 but could not sustain this and currently trades below 1.19. USD/JPY spent most of the time trading with a 139 handle after making a new low at 137.65 on the softer US PPI figures.
AUD/USD was the best performer trading close to 0.68. USD/CAD continued its recent consolidation. Support remains intact around the July high at 1.3223 and 100-day SMA at 1.3237. Gold punched up above $1780 but pulled back slightly. Gold bugs may target the 200-day SMA at $1802.
Stocks: US equities were choppy as earlier soft PPI optimism was scaled back. The S&P 500 closed up 0.87%. The benchmark index has gained nearly 14% from its intraday low in the second week of October. The Nasdaq jumped 1.45% with growth and quality stocks leading. It is the only major index on pace so far to eke out small gains for the week. The Dow added 0.17%.
Asian stocks traded lower throughout the session. But indices climbed off their session lows. The Nikkei 225 fell back below 28k, but losses were cushioned by the weaker yen. The Hang Seng traded with losses as Chinese equities took a breather from recent upside.
US equity futures are choppy but in the green. European equity futures trimmed losses of more than 1%. The cash market closed up +0.7% yesterday.
Day Ahead– Dollar pulls back from the brink
It may have been just one data point (last week’s US CPI) but markets are latching onto any other similar data. Yesterday saw the release of weaker than expected Producer Prices. This drove equities higher and the DXY below support at 105.78 before rebounding on the Poland events. The 200-day SMA is at 104.94. It seems this may be a near-term theme with the dollar more susceptible to soft economic data. Technical momentum is building against the USD as well.
We mentioned in this week’s webinar that FOMO (Fear of Missing Out) was making a comeback. According to data from the Bank of America, fund managers have been holding more cash than at any point since 2001. As we approach year-end, they will have to decide whether to join a prolonged Santa rally in stocks. This would add further to the deterioration in USD sentiment. Of course, we do need to be mindful of geopolitical risks and nay safe haven buying.
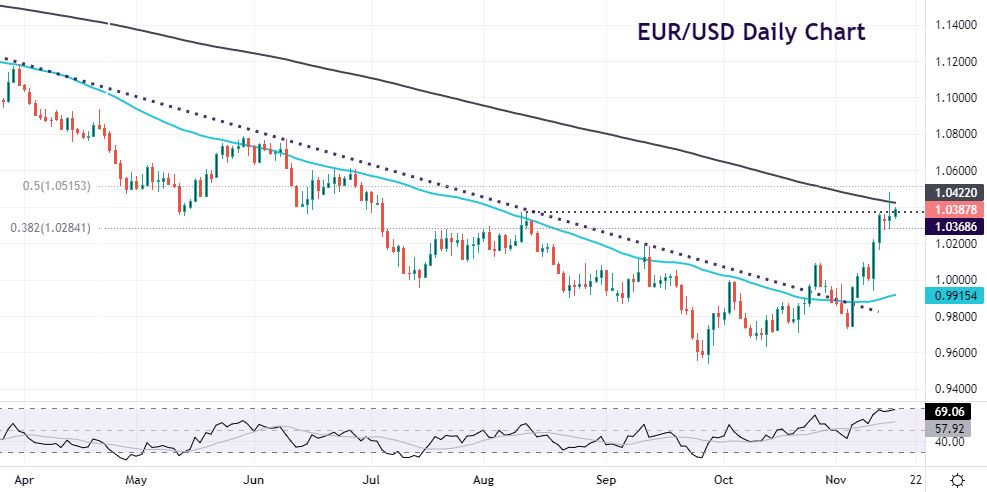
Chart of the Day – EUR/USD touches 200-day SMA
Yesterday saw the euro reach its highest level against the dollar since July. Markets are shaking off yesterday’s Polish skirmish. The significant energy risks ahead of the winter months are also being looked through. Positive data from the German ZEW survey yesterday helped sentiment. It remains deeply negative, but expectations bounced way ahead of forecasts.
Technically, the euro’s break out of this year’s bear channel has seen it flirt with the 200-day SMA at 1.0422. Prices are currently trading around the August high at 1.0368 which has capped upside recently. Support is at 1.0284 the 38.2% Fib level of this year’s decline. The halfway point of that move is 1.0515.
The information has been prepared as of the date published and is subject to change thereafter. The information is provided for educational purposes only and doesn't take into account your personal objectives, financial circumstances, or needs. It does not constitute investment advice. We encourage you to seek independent advice if necessary. The information has not been prepared in accordance with legal requirements designed to promote the independence of investment research. No representation or warranty is given as to the accuracy or completeness of any information contained within. This material may contain historical or past performance figures and should not be relied on. Furthermore estimates, forward-looking statements, and forecasts cannot be guaranteed. The information on this site and the products and services offered are not intended for distribution to any person in any country or jurisdiction where such distribution or use would be contrary to local law or regulation.
