Stocks find a bid ahead of pivotal US CPI data

Headlines
*US headline CPI set to ease, core rate poised for increase
*USD down for a fourth day after posting 20-year highs
*Fed set for another 75-basis point rate hike, early pivot unlikely
*Asian equities extended global rally into US CPI report
USD is relatively steady in the overnight session, slightly extending losses. After hitting 110.78 on the DXY, prices have moved towards 108. The 50-day SMA is at 107.52. EUR soared to 1.0197 before printing a doji and closing at 1.0119. GBP gained 0.85% with a high at 1.1710. USD/JPY traded modestly lower before closing at 142.83. Last week’s multi-year high was 144.99. AUD pushed up into its 50-day SMA at 0.6894. USD/CAD dropped for a fourth straight session below 1.30.
US equities rose for a fourth consecutive day posting solid gains of 1%+. There is a strong negative correlation between the dollar and US stock market. Many multinationals have higher earnings when the greenback depreciates. Asian equities advanced led by a jump in South Korea’s Kospi. The MSCI Asia-Pacific ex-Japan index has risen four days in a row, bouncing back from two-year lows. Futures are mildly in the green.
Day Ahead – Has US CPI peaked?
All eyes are on the US inflation data for August. This is the last major economic release ahead of next week’s FOMC meeting. Consensus sees a drop of 0.1% m/m in the headline print. That brings the annual rate down for a second consecutive time to 8.1% from 8.5% in July. A double-digit decline in fuel prices in the chief culprit.
The core data should grab the attention. Analysts see a rise of 0.4% m/m, a tick up from the last reading. The y/y print is seen increasing to 6.1% from 5.9%. There are upside risks here. Rent and shelter costs, which make up a large part of the index, remain sticky.
Markets may take a “glass half-full” approach and view the decelerating headline as sufficient to square positions. Stocks and FX have already corrected on ruling trends over the past sessions. Resistance in EUR/USD is around 1.02, GBP/USD at 1.1759. Money markets currently discount a peak Fed funds policy rate at 4%, a high in the cycle. A 75bp rate hike next week is given an 88% chance.
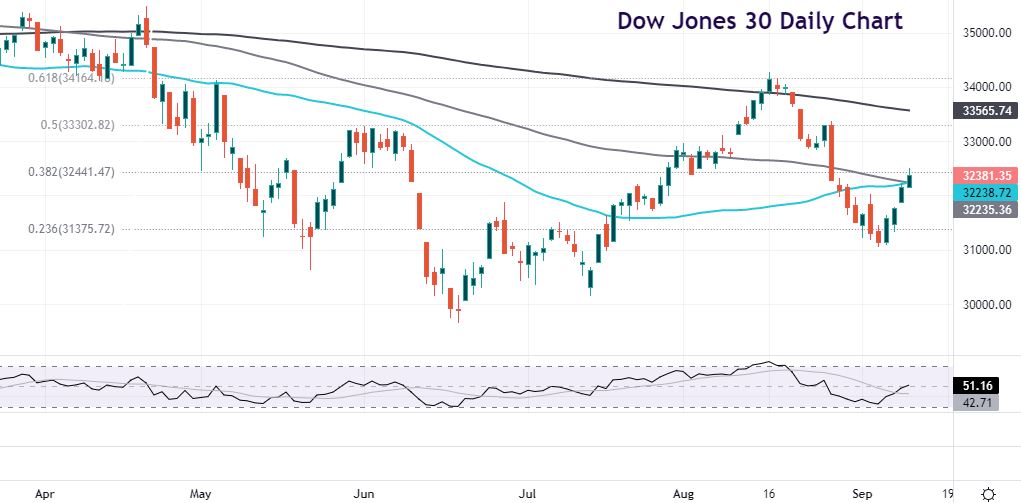
Chart of the Day – Dow breaks above SMAs
The Dow Jones Industrial Average looked weak last week as it moved towards 31,000. But buyers stepped in around support at 31,375 and the index has rallied for four straight days.
Yesterday saw the advance move up through both the 50-day and 100-day simple moving average. These levels now act as initial support at 32,236/38. Resistance above sits at the Fib level (38.2%) of the year’s high/low move at 32,441. Above here sits the halfway point of that move at 33,302.
The information has been prepared as of the date published and is subject to change thereafter. The information is provided for educational purposes only and doesn't take into account your personal objectives, financial circumstances, or needs. It does not constitute investment advice. We encourage you to seek independent advice if necessary. The information has not been prepared in accordance with legal requirements designed to promote the independence of investment research. No representation or warranty is given as to the accuracy or completeness of any information contained within. This material may contain historical or past performance figures and should not be relied on. Furthermore estimates, forward-looking statements, and forecasts cannot be guaranteed. The information on this site and the products and services offered are not intended for distribution to any person in any country or jurisdiction where such distribution or use would be contrary to local law or regulation.
