Risk rally subdued as USD rises

* Gold finds a haven bid, Bitcoin makes fresh record intraday high
* Stocks mixed again in choppy week, Nvidia beats after hours
* UK CPI jumps to 2.3% underscoring BoE’s stance for rate cuts
* Eurozone wage growth surges in test for ECB policy easing
FX: USD halted a three-day slide in what could be a bull flag before a break to fresh two-year highs. The prior year-to-date top is at 106.51 with the October 2023 peak at 107.34. Geopolitical tensions are high in the Ukraine/Russia conflict. This comes after Ukraine fired long-range US-made cruise missiles into Russia which caused Putin to amend their nuclear doctrine. Fed speakers generally set out a course for another rate cut in December.
EUR suffered as both geopolitical and trade tensions once again hit the single currency. Last week’s low is at 1.0495 with a long-term level at 1.0448 from October 2023. The ECB warned about risks to financial stability in the region posed by trade tensions. Contrasting to this was elevated wage demands as data showed negotiated wage growth picked up to 5.4% in Q3 from 3.5% in Q2.
GBP initiallyoutperformed its G10 peers as CPI data rose more than expected. Both the headline and core readings were hotter with the former predicted to potentially hit 3% in the months ahead. Key services inflation also remains sticky around 5%. This all means likely caution from the BoE regarding policy easing. Last week’s low is at 1.2596.
USD/JPY picked up, with prices heading closer to last week’s top at 156.74. Treasury yields rose marginally supporting the major. We are in verbal intervention territory around 155.
AUD tanked with bears looking at recent lows at 0.6440. USD/CAD looks to have found support around the August spike high at 1.3946. There’s roughly a 30% risk of a 50bps rate cut at the next BoC meeting.
US Stocks were mixed with price action choppy. The S&P 500 settled flat at 5,917. The tech-laden Nasdaq 100 lost 0.09% to finish at 20,667. The Dow finished up 0.32% at 43,408. There was a late rally into the close which got the indices off their lows. Nvidia post-close beat on its top and bottom lines. The giant chipmaker reported third-quarter earnings that beat expectations for sales and earnings while delivering a better-than-expected forecast for the current quarter. Revenue continues to surge at Nvidia, rising 94% on an annual basis during the quarter that ended on October 27. Shares dipped in after hours, down just over 1%.
Asian stocks: Futures are in the red. Asian equities were mixed with eyes on Nvidia earnings and Ukraine-Russia tensions. The ASX 200 retraced from record highs with a quiet calendar. The Nikkei 225 traded indecisively with little help from better than forecast trade data. The Hang Seng and Shanghai Composite again moved between gains and losses.
Gold moved higher for a third straight day with the 100-day SMA in sight at $2658. This rebound is reversing some of the 9% decline seen since record highs in late October.
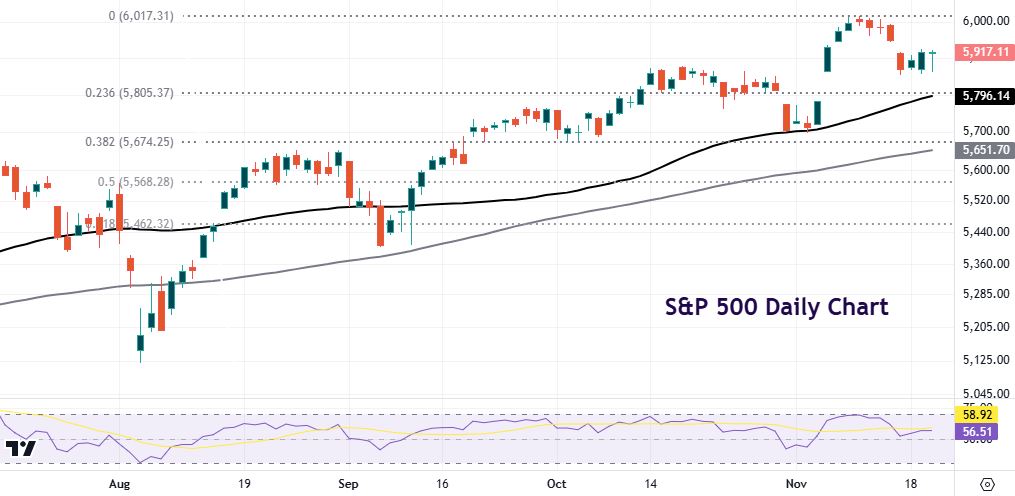
Chart of the Day – S&P 500 in consolidation mode
It’s always interesting when you get big, notable headlines – Reuters recently noted that “the S&P 500 is having one of its best calendar years since 1928”. That has put some on guard and in contrarian mood, asking if the Trump Trade has run its course for now. November returns of above 3% so far for the benchmark index are well ahead of the average of the past 35 years of 2.3%. Investor sentiment is strongly bullish. But market breadth is softening. How long will the classic “FOMO” mentality last?
A Santa rally would take the index up to record highs above 6,000. Otherwise, a deeper correction will challenge initial support at 5,805 which sits just above the 50-day SMA at 5,795. The next, major Fib retracement level (38.2%) of the August rally is at 5,674.

The information has been prepared as of the date published and is subject to change thereafter. The information is provided for educational purposes only and doesn't take into account your personal objectives, financial circumstances, or needs. It does not constitute investment advice. We encourage you to seek independent advice if necessary. The information has not been prepared in accordance with legal requirements designed to promote the independence of investment research. No representation or warranty is given as to the accuracy or completeness of any information contained within. This material may contain historical or past performance figures and should not be relied on. Furthermore estimates, forward-looking statements, and forecasts cannot be guaranteed. The information on this site and the products and services offered are not intended for distribution to any person in any country or jurisdiction where such distribution or use would be contrary to local law or regulation.
