The most important skill to develop as a trader is formulating a set of rules to determine when to open a position, how to manage it and the right time to close it. This is where forex trading strategies come into play, helping new traders to master the basics. Here are some of the most popular forex trading strategies for beginners.

#1 – Price Action Trading
As a beginner, you can simply focus on the movements of a currency pair over a short period of time to determine entry and exit points. This strategy does not involve the use of any technical indicators and is, therefore referred to as price action. When using this strategy, some traders do use a technical indicator, but merely as a supporting tool rather than basing all their decisions on it.
Many new traders prefer price action trading because the charts are clean and do not involve the confusion that can sometimes be created by multiple indicators showing conflicting signals.
Tip: Price action trading is most suitable for day traders who trade only when they can closely monitor charts and look to identify small trading opportunities.

#2 – Trend Trading Strategy
This is among the most common forex trading strategies for beginners, mainly because it is quite straightforward to understand. Trend trading involves using the simplest technical indicators to identify the trend, such as Moving Average, Supertrend, and Parabolic SAR. These indicators are free and can be implemented on the forex chart simply by dragging and dropping.
In the trend trading strategy, the idea is to identify the direction in which the market is currently moving (trend) and determine the stability of the trend. The stability can be determined based on three factors: the overall direction of the market, the duration of the trend and the volume of trades being placed.

Moving Average
Let’s say a trader chooses to use the Moving Average indicator. This smooths out price data on a chart because it converts all the price data into average prices and represents them in the form of a flat line. A trader can choose various timeframes when using this indicator. While short-term traders use 30-minute, one-week or 10-day simple moving averages, long-term trend traders use 200-day, 100-day, and 50-day moving averages. When the flat line moves downward, the market is said to be declining or in a downtrend. Similarly, when it moves upward, the market is said to be rising or in an uptrend.
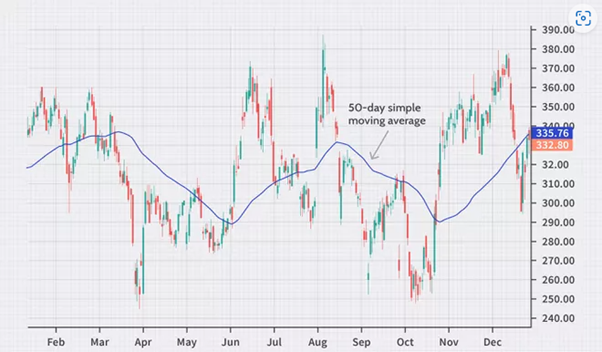
Tip: Once the trend has been identified, traders often use a momentum indicator to determine the strength or stability of the trend.
Moving Average Crossover
Crossovers are used to analyse moving averages. The most popular combination is the 50-day and 200-day simple moving averages. When the 50-day line moves above the 200-day one, it represents a buy signal. On the other hand, when the 50-day falls below the 200-day line, it is seen as a sell signal.
Moving average crossovers help you identify the end of one trend and the beginning of another.

When a shorter moving average (say 50-day MA) crosses above the longer moving average (say 200-day MA), it is considered a bullish crossover and is known as the Golden Cross. When the shorter MA goes below the longer one, it is considered a bearish crossover and is known as the Death Cross.
Tip: Instead of using simple moving average, consider using exponential moving average (EMA), which assigns a higher weight to more recent datasets.
#3 – Momentum Trading Strategy
This forex trading strategy focuses on the strength of the trend. It is based on the belief that a strong trend will continue in the same direction, whether upward or downward. The momentum of the trend is determined by looking at the trading volume, volatility and timeframes. The most common technical indicators used for momentum trading are Moving Average Convergence Divergence (MACD), Relative Strength Indicators (RSI), and Stochastics.
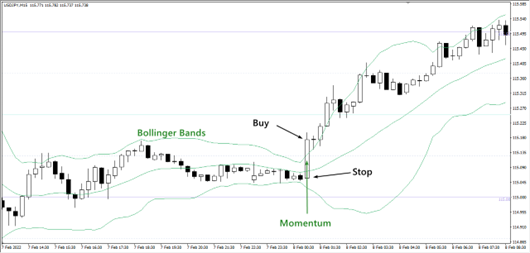
Traders open their position when the trend starts gaining momentum and close their position when the trend slows.
Tip: Any major geopolitical news, the release of important economic data, and interest rate announcements by central banks can significantly increase the momentum of a forex pair.
Moving Average Convergence Divergence (MACD)
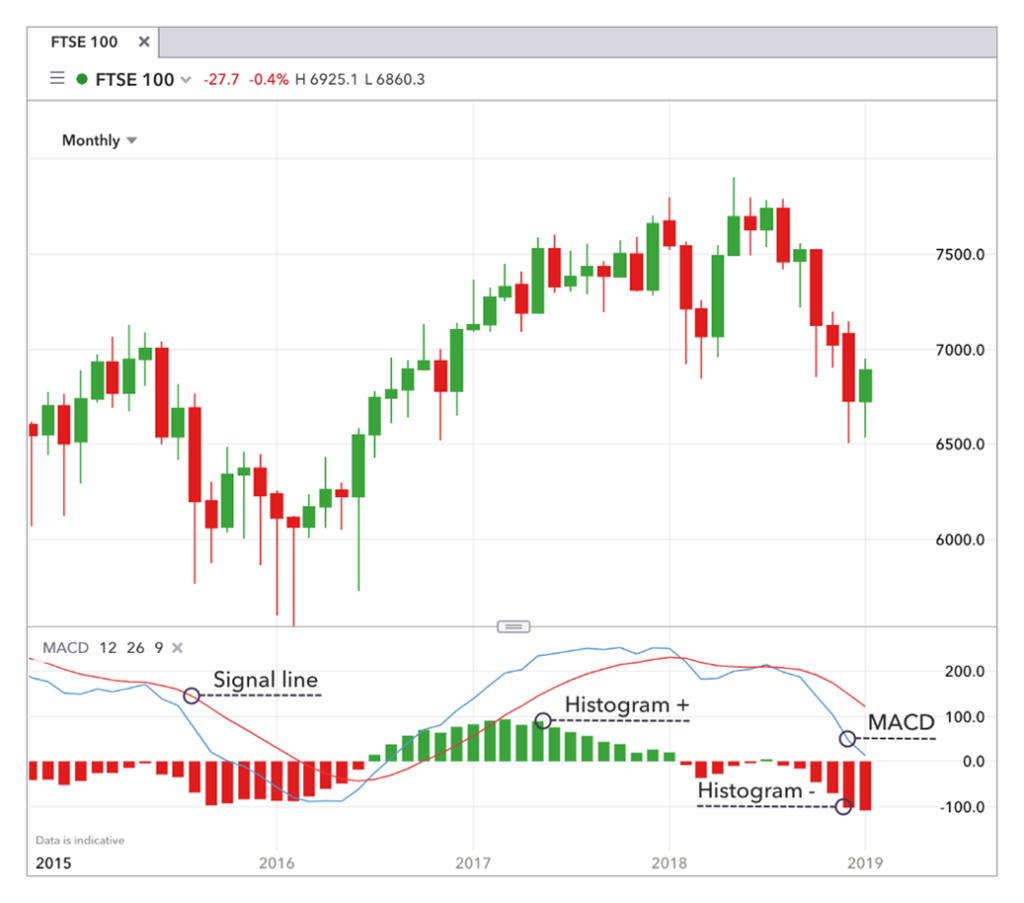
This forex trading strategy helps traders identify whether the identified uptrend or downtrend in the market is strengthening or weakening. MACD lags the trend but gives a quick snapshot of the momentum in the market. It is calculated by subtracting the 26-day EMA from the 12-day EMA. In this strategy, the nine-day EMA is called the “signal line,” and is plotted on top of the MACD line.
When the MACD line crosses above its signal line, it is considered an indication to buy the currency. Conversely, when the MACD crosses below the signal line, it is taken as a signal to sell or go short.
You may choose to view the MACD as a histogram rather than a line. This can be easily incorporated below the main chart view. The histogram plots the distance between the MACD and the signal line. If the MACD is above the signal line, the histogram will appear above the baseline of the MACD. If the MACD is below its signal line, the histogram will appear below the baseline. The more the histogram extends beyond the baseline, the greater the momentum or strength in the trades. If the histogram remains significantly above the baseline for longer, it indicates a high bullish momentum, whereas the histogram remaining significantly below the baseline represents a high bearish momentum. Many experienced traders use the histogram version of MACD along with other indicators to formulate their forex trading strategies.
Relative Strength Index (RSI)
This is the most popular indicator used for determining the stability of the trend when using the trend trading strategy. The RSI measures the speed and magnitude of changes in the forex pair and is used to identify overbought and oversold markets. When the RSI value is above 70, it indicates overbought conditions, which presents opportunities to go short. When the RSI reading is below 30, it suggests an oversold market.
When using this indicator as the primary tool for trading signals, it’s important to wait patiently for the market to enter an overbought state during an uptrend or an oversold state during a downtrend.
Tip: Momentum trading works well only for forex pairs with high liquidity. Moreover, new traders often use momentum indicators as the supporting tool, rather than the primary one, for determining entry and exit points.
#4 – Range Trading Strategy
When a currency pair is constantly moving within two price levels, it is said to be in a range, or the market is said to be rangebound. Traders identify upward or downward trends within that price range as the market does not show any clear direction. The range can be anything from a few pips to several hundred pips, depending on the timeframe you are trading.
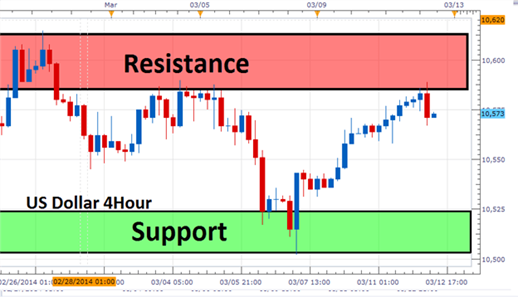
Traders start by choosing the highs and lows of the chart and then the support and resistance levels. After this, the overbought and oversold states of the currency are tracked. When the forex pair is overbought and the chart reaches the resistance level, it indicates an opportunity to sell. When the currency pair is oversold and reaches the support level, this represents an opportunity to buy.
Tip: The most popular technical indicator used to mark the range of borders is Bollinger Bands.
#5 – Breakout Strategy
Being able to identify a trend and place a trade in the right direction is a great achievement. What’s even better is to identify a trend just when it’s about to be formed. Placing a trade in the right direction at this point leads to the maximum returns. Traders following the breakout forex trading strategy look for these opportunities.
Markets sometimes range between support and resistance levels. This is known as consolidation. When the market moves beyond the boundaries of consolidation to new highs or new lows, a breakout is said to have taken place. A breakout must occur right before a new trend sets in. Breakout points are, therefore, signals of the onset of new trends and offer the most interesting opportunities to traders to take positions. However, traders need to bear in mind that not all breakout points convert into a new trend.
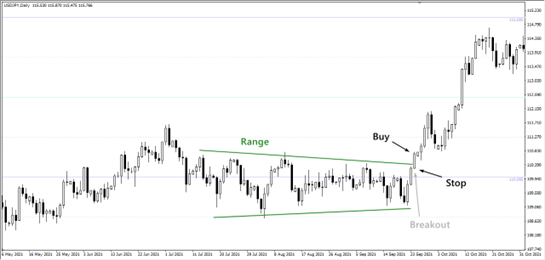
Tip: Try to identify a forex pair that has a strong support or resistance level. The stronger the support or resistance level, the stronger could be the breakout.
#6 – Carry Trade Strategy
Carry trade strategy is used by beginners and professionals alike. The objective of this strategy is to profit from the difference in interest rates between the two currencies in a forex pair. Traders borrow or sell a currency with a low interest rate and then buy a currency with a high interest rate. The trader can then earn more interest from the currency with a high interest rate and pay interest on the currency with a low interest rate. After deducting the interest earned and paid, the difference is the earnings from the trade.
For the earnings to be a meaningful sum, traders need to hold the position for longer. However, during this time, the foreign exchange rate of the currency pair may change, which will impact the earnings from the trade. In some cases, the fluctuation in the forex pair may wipe out the earnings or may even lead to losses.
Many experienced traders use leverages for carry trade, to magnify their earning potential. However, leverage also enhances the risks involved and needs to be used with caution. Beginners while using this strategy are advised to start trading with low leverage.
Tip: It’s best for new traders to try out this strategy using a demo account, so that they can choose the forex pair carefully and fully understand the associated risks.
#7 – News Trading Strategy
If you are interested in any particular currency pair, you may follow the news events related to those currencies. Trading the news can offer some interesting trading opportunities as markets tend to become extremely volatile during major news events. On the flip side, high volatility also makes this trading strategy quite risky.
#8 – Swing Trading Strategy
This involves holding positions open for several days. Traders use charts ranging from hourly to daily or even weekly for this strategy and continue looking for bigger trading opportunities. This requires a lot of patience and discipline. Without patience and discipline, you may close the trades too early and forgo gains that you could have booked. There is also the risk of holding on to the positions for too long, even when the market begins moving in the opposite direction to what you anticipated. Since markets are continuously moving, some traders hold onto positions with the belief that the forex pair will soon move in the desired direction.
Swing trading requires a more in-depth study of the market and all the factors that impact the two currencies in the forex pair, since you would be holding the position open for several days or even weeks.
Tip: Traders need to combine technical and fundamental analysis for swing trading.
#9 – Scalping Strategy
This is among the most fast-moving forex trading strategies. It is an intraday strategy in which traders aim to take advantage of very small price movements. The duration for which the position is kept open ranges from a few seconds to a few minutes. The objective is to make small gains on several trades.
Traders using the scalping strategy are also called Scalpers. The trader needs to be highly focused during the trading session, be good with numbers and have the ability to make quick decisions, even in high-pressure situations.
Tip: It is very important to control your emotions and focus on market signals alone to anticipate sudden price movements.
#10 – Position Trading
In sharp contrast to scalping, position trading involves holding the forex pair for longer timeframes and ignoring the short-term price fluctuations. Position trading requires the traders to remain calm and highly disciplined even when the trend is moving against them.
Before trying these forex trading strategies in the real market, it’s a good idea to practise on a free demo account. You may try different forex trading strategies to choose the ones that you are most comfortable with. Also, remember to use risk management techniques when trading. Most traders use stop loss and take profit to manage risks.
Power your trading with Vantage Markets.
Open a RAW ECN account and start trading with spreads from 0.0 pips.
The information has been prepared as of the date published and is subject to change thereafter. The information is provided for educational purposes only and doesn't take into account your personal objectives, financial circumstances, or needs. It does not constitute investment advice. We encourage you to seek independent advice if necessary. The information has not been prepared in accordance with legal requirements designed to promote the independence of investment research. No representation or warranty is given as to the accuracy or completeness of any information contained within. This material may contain historical or past performance figures and should not be relied on. Furthermore estimates, forward-looking statements, and forecasts cannot be guaranteed. The information on this site and the products and services offered are not intended for distribution to any person in any country or jurisdiction where such distribution or use would be contrary to local law or regulation.


