Markets stall as they await FOMC minutes and data

Headlines
* Caixin PMI: China’s services activity softens as recovery falters
* Dollar steady before Fed minutes, yen hovers below intervention zone
* Oil drifts as traders take stock of OPEC+ supply curbs
* Asian shares fall on growth concerns, focus shifts to data
FX: USD again traded in a narrow range as US stocks and bond markets were closed for the Independence Day holiday. The DXY continues to trade around the 50- and 100-day SMAs just above 103. The 2-year yield is consolidating its recent move higher after touching 4.96% on Monday. The 10-year yield is trading just above long-term trendline resistance above 3.80%.
EUR slipped beneath 1.09. The 50-day SMA stays as near-term support at 1.0862. GBP sticks above 1.27 in quiet trade. There is little on the UK calendar of note. That means cable will be driven by the USD side. USD/JPY continues to track sideways. This is just below the previous 145 intervention level. AUD reversed initial disappointment after the unchanged RBA decision. The 100- and 200-day SMAs at 0.6692/4 are resistance. USD/CAD could be rolling over after failing to move above the February low at 1.3262. North American labour market data on Friday will be key for direction.
Stocks: US equities were closed for Independence Day.
Asian stocks traded lower on softer China PMI data. The Nikkei 225 held above the 33,000 level after initial falling at the open. The Hang Seng was muted with ongoing trade-related tensions between the West and China. The Caixin Services PMI printed its slowest pace of increase since January.
US equity futures are very modestly in the red. European equity futures are pointing to a slightly lower open. The Euro Stoxx 50 closed -0.2% yesterday. The cash market finished down by 0.2% on Tuesday.
Gold enjoyed a fourth consecutive day of (small) gains. Resistance sits at the 100-day SMA and the bottom of the recent range around $1940/6. The manufacturing PMI brought some relief with another slide in the prices paid element. Focus turns to the FOMC minutes.
Day Ahead – Fed minutes and reopen of US markets
The thin liquidity at the start of the week should change as US traders return to their desks. S&P 500 futures managed to extend their recent gains, closing in on 4,500. The mild pullback disguises the recent strong sentiment that there will be no recession or only a very mild soft landing. That would mean inflation eventually falling to its policy target in good time.
We have talked before how hard it is for policymakers to “thread the needle”. Raising interest rates is done to slow demand and crimp economic activity. Historically, that can result in something breaking or a policy mistake. In the meantime, the VIX is well below its long-term average of 20. Today’s FOMC minutes will shed light on the “skip” decision at the recent meeting. Relatively hawkish minute are expected. This is due to the new dot plot which showed two more rate increases this year. Focus will also be on jobs data ahead of Friday’s NFP report.
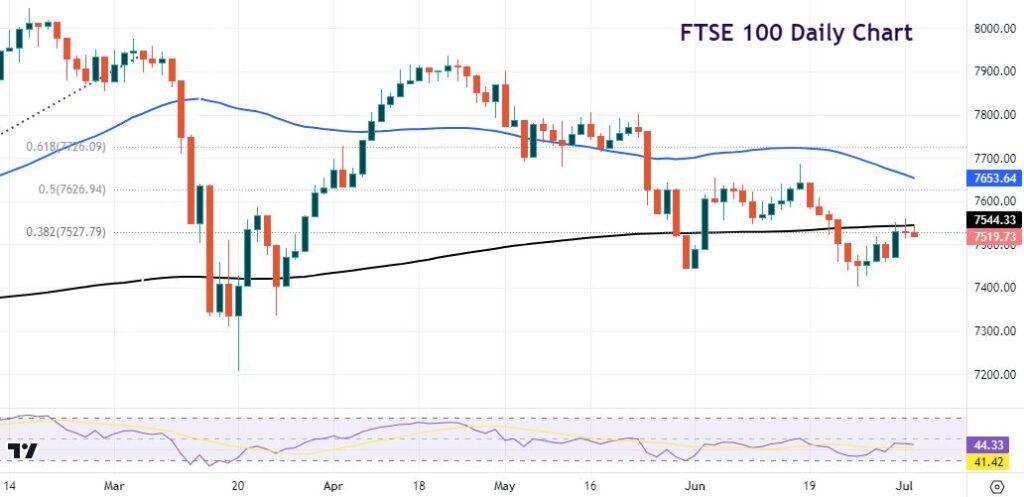
Chart of the Day – FTSE 100 struggles under 200-day SMA
The UK’s main index has failed to keep up with other major global stock indices this year. The FTSE 100 just about finished the first half in the green. Compare that to the Nasdaq’s 32% gain, the S&P 500 moving 16% higher and the Dax adding 14%. Stubborn CPI and rising interest rates have been a big drag. The index is made up of interest rate sensitive stocks like banks, homebuilders, and insurers. Add oil majors, energy and mining companies to the mix and it is not hard to see why there has been underperformance. This is especially due to the lack of tech stocks which have fuelled the US rally.
A strong pound also hurts the FTSE 100 as 75% of companies recieve revenue from overseas. Initial support sits at the May low at 7445/6. This is just above the June spike low at 7401. The index is currently just below the 38.2% Fib level of the February to March fall at 7527. Resistance resides at the 200-day SMA at 7544. The 50% point of the February to March fall is 7626.

The information has been prepared as of the date published and is subject to change thereafter. The information is provided for educational purposes only and doesn't take into account your personal objectives, financial circumstances, or needs. It does not constitute investment advice. We encourage you to seek independent advice if necessary. The information has not been prepared in accordance with legal requirements designed to promote the independence of investment research. No representation or warranty is given as to the accuracy or completeness of any information contained within. This material may contain historical or past performance figures and should not be relied on. Furthermore estimates, forward-looking statements, and forecasts cannot be guaranteed. The information on this site and the products and services offered are not intended for distribution to any person in any country or jurisdiction where such distribution or use would be contrary to local law or regulation.
