Stocks stabilise while USD tracks sideways

Headlines
* China February services activity jumps sharply as demand recovers
* Eurozone headline inflation drops but surging core rate lift hike bets
* Dollar’s renewed strength temporary, weakens ahead – Reuters Poll
* Asian stocks set to snap four-week loss on dovish Fed comments
FX: USD made gains against most of its peers. The DXY posted highs above 105 but has pulled back this morning. Hawkish data with jobless claims remaining below 200k and a big upward revision in Q4 labour costs offered support. But one Fed official, Bostic, who suggested a potential pause from mid-summer slowed the buying. The benchmark US Treasury 10-year yield powered ahead to a top at 4.08%. The 2-year yield hit 4.94% which was last seen in 2007 before the GFC.
EUR gave up nearly all of its gains from the previous day, despite hot inflation data. It closed lower at 1.0596. GBP softened towards 1.1948 and very close to prior support at its 200-day SMA at 1.1913. Dovish-leaning BoE comments and a report watched closely by the MPC showed a fall in inflation expectations. USD/JPY was relatively quiet but pushed up to make a new high at 137.10. A long-term Fib level sits at 137.24. This resistance zone also includes the 200-day SMA at 137.29. AUD is in consolidation mode and trading sideways above 0.6681 support. USD/CAD has backed off recent highs around 1.3665. Canadian GDP data disappointed recently but probably reflected temporary one-offs.
Stocks: US equities initially fell before closing firmly in the green. The blue-chip S&P 500 gained 0.76% and ended just below the crucial 4k level. The tech-laden Nasdaq 100 added 0.89%. The Dow enjoyed its best session since the middle of February, finishing more than 1% higher. Macy’s shares surged after it gave an upbeat profit forecast amid the retail gloom. Best Buy disappointed with its sales outlook.
Asian stocks traded mostly higher as the region digested further strong Chinese Caixin PMI data. The Nikkei 225 outperformed after data showed Tokyo inflation began to soften. The Hang Seng gained on the decent PMI data which was the fastest pick-up in activity since August. Focus is on this weekend’s “Two Sessions” annual event which may see changes to President Xi’s leadership team and also growth target.
US equity futures are modestly in the red. European equity futures are pointing to a stronger open. The Euro Stoxx 50 cash market finished higher yesterday, up 0.6%.
Gold had a narrow range day but is seeing bids this morning. Real yields, so those adjusted for inflation have actually softened this week. That explains the 1.7% rise on the week in the yellow metal so far, along with the softer dollar.
Data Breakdown –European data forces more ECB hikes
Two important releases for the Euro area saw rate hike bets pushed ever north. Core inflation rose to 5.60% in February as both core goods (6.8%) and services (4.8%) reached new record highs. Until we see the first signs of underlying inflation peaking, the ECB is unlikely to slow the pace of tightening. That means another 50bp hike in May is in play. This would come after the nailed on 50bp in a couple of weeks’ time.
The minutes of the ECB’s February meeting showed a decidedly hawkish debate and a determination to raise rates beyond March. Moving them further into restrictive territory does increase the risk of adverse effects on the economy. That means there may be less forward guidance going froward, and an increased meeting-by-meeting approach. EUR/USD is struggling to keep above 1.06 at the moment, even with the hawkish moves in ECB pricing.
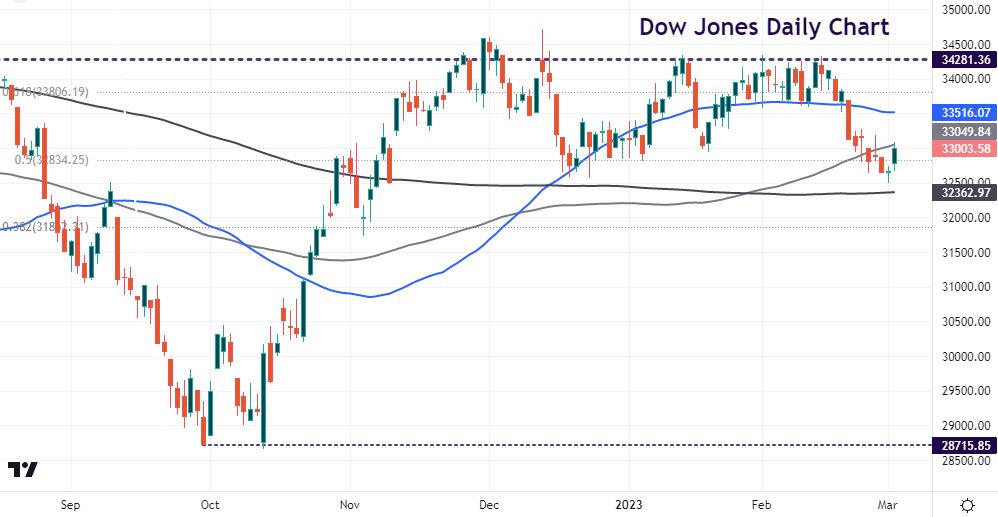
Chart of the Day – Sell off in the Dow slows
US stocks went higher yesterday despite the rise in bond yields. This probably happened due to stronger than expected growth data, which countered the inflation figures.
The Dow tumbled below its 50-day SMA above 33,500 at the back end of last month. Prices also fell below the 100-day SMA more recently. But yesterday touched this indicator at 33,049. We are currently trading around the 50% mark of the 2022 decline just below 33,000. The 200-day SMA sits as support at 32,362.
The information has been prepared as of the date published and is subject to change thereafter. The information is provided for educational purposes only and doesn't take into account your personal objectives, financial circumstances, or needs. It does not constitute investment advice. We encourage you to seek independent advice if necessary. The information has not been prepared in accordance with legal requirements designed to promote the independence of investment research. No representation or warranty is given as to the accuracy or completeness of any information contained within. This material may contain historical or past performance figures and should not be relied on. Furthermore estimates, forward-looking statements, and forecasts cannot be guaranteed. The information on this site and the products and services offered are not intended for distribution to any person in any country or jurisdiction where such distribution or use would be contrary to local law or regulation.
