Risk mood cautious as dollar steadies after this week’s drop

Headlines
*Republican wave fails to materialise in early US midterm results
*Gold advances over 2% on dollar slide, technical buying
*Asia stocks edge lower amid US election update and China’s Covid woes
FX: USD fell for a third day, something last seen in early August. Seasonal pressures are USD negative. The DXY touched the lows of the recent 5-week range. Support is seen at 109.24 and then the 100-day SMA at 108.99. US Treasury yields fell back to 4.15% on the 10-year. October highs are 4.33%.
EUR/USD moved above the 100-day SMA at 1.0036. But the world’s most popular currency pair couldn’t close beyond the October highs at 1.0088/93. There was more hawkish rhetoric from ECB officials de Guindos and Nagel. GBP/USD hit a high of 1.1599 before falling back. The BoE’s Pill suggested that the bank hasn’t defeated second-round inflationary effects. There was also a report that the UK and EU are close to a breakthrough in the Brexit spat. USD/JPY fell as the yen benefitted from narrowing yield differentials. The major is trading around the 50-day SMA at 145.37.
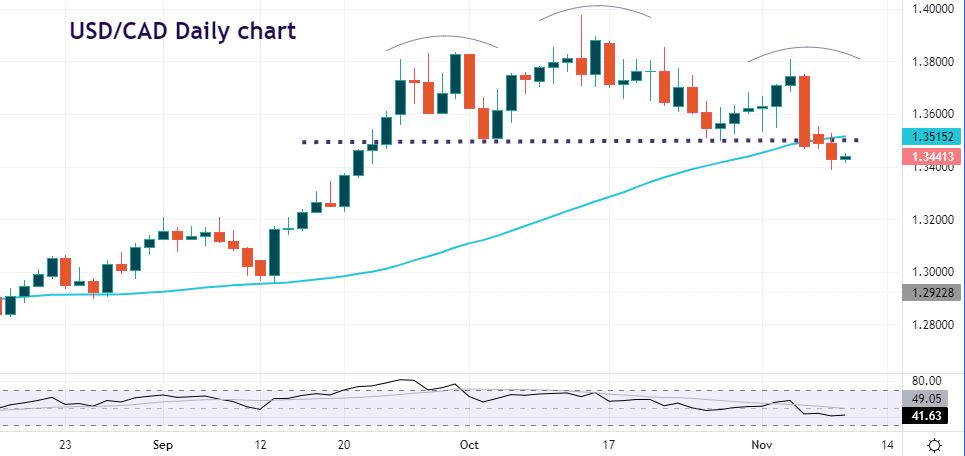
AUD/USD popped higher to 0.6551 before pulling back to the 50-day SMA at 0.6507. There is broad area of resistance from October at 0.6522/47. USD/CAD fell below the Fib level (38.2%) of the August rally at 1.35. A potential head and shoulders reversal pattern has formed. Gold jumped higher, breaking through the critical levels around $1672/6. The 2% move higher touched the 100-day SMA at $1716 which is initial resistance.
Stocks: US equities moved north for a third day amid choppy price action and softer Treasury yields. Collapsing digital assets saw Bitcoin make fresh year-to-date lows. This followed Binance’s acquisition of FTX and a 76% drop in the FTX token. The Dow continued to outperform, gaining 1.02% as cyclicals took the lead. Bulls are eyeing the August high at 33,364. The Nasdaq added 0.75% and the broader S&P 500 closed higher +0.56%.
Asian stocks traded cautiously amid a trickling of results from the US midterms. The Nikkei 225 faded its initial gains. Chinese stocks swung between gains and losses. Covid-related headwinds persisted following a further increase in daily infections.
S&P 500 futures are mixed. European equity futures are subdued after the cash market closed up 0.8% yesterday.
Day Ahead – US mid-term elections results
The latest exit polls point to the Republicans winning control of the House. This was a tighter race than expected and the Senate appears too close to call. It may take days or even weeks until the final results are confirmed, especially for the Senate. The results are likely to be in line with what prediction markets expected.
A divided government seems the probable outcome currently with the Republicans controlling at least the house. This means there will limited chances to push forward major legislative programs. As we mentioned yesterday, stocks may benefit the most with this result. Over the last 18 midterm election cycles, the S&P 500 has advanced around 5% in the year leading up to election day. But the benchmark has moved by more than 15% in the 12 months after. Only a Democrat victory in both the House and Senate would weigh on equities as markets might expect more corporate tax rises.
Chart of the Day – USD/CAD head and shoulders pattern
General USD softness is helping USD/CAD break down in a potential reversal pattern. Last week’s strong jobs report out of Canada is also providing some support for CAD sentiment. BoC Governor Macklem speaks tomorrow and may give us more guidance on the policy outlook.
It looks like the right-hand side of a head and shoulders top/reversal pattern formed around the mid-October peak in the USD. The neckline trigger sits around 1.35 which is also a Fib level of the August rally and the 50-day SMA at 1.3515. If we continue lower the measured move target from the 1.40 spike high would be around 1.30.
The information has been prepared as of the date published and is subject to change thereafter. The information is provided for educational purposes only and doesn't take into account your personal objectives, financial circumstances, or needs. It does not constitute investment advice. We encourage you to seek independent advice if necessary. The information has not been prepared in accordance with legal requirements designed to promote the independence of investment research. No representation or warranty is given as to the accuracy or completeness of any information contained within. This material may contain historical or past performance figures and should not be relied on. Furthermore estimates, forward-looking statements, and forecasts cannot be guaranteed. The information on this site and the products and services offered are not intended for distribution to any person in any country or jurisdiction where such distribution or use would be contrary to local law or regulation.
