Will US CPI data wake up these sleepy markets?

Headlines
*China consumer inflation reaches two-year high as pork surges
*Consensus expects US CPI to have eased slightly in July
*US dollar trades with little direction, holds support on DXY
*Asia stocks track Wall Street losses ahead of US data
US equities dipped with tech dragged down by Micron’s warning of slowing consumer demand. The Nasdaq fell 1.15% and the benchmark S&P500 closed down 0.4%. The warning compounded bearish sentiment in the sector after disappointing results for peer Nvidia. Asian stocks are generally lower while US futures are marginally in the red.
USD tracked sideways as summer markets and traders await the main risk event of the week. EUR steadied above 1.02 and GBP around trendline resistance just below 1.21. USD/JPY printed another “doji” trading on the 50-day SMA at 135. AUD stayed mildly offered below the key 0.70 level amid downbeat China inflation.
Day Ahead – US CPI incoming
Consensus expects headline inflation to have increased 0.2% from June to July. Annual inflation is forecast to have reached 8.7%, below the 9.1% print for June. Core inflation – which strips out volatile food and energy costs – is seen rising to 0.5%. This should keep the year-on-year rate at 6% and focus the minds of officials at the Fed.
A higher-than-expected print will lead to another round of hawkish Fed rate hike expectations. This should prompt another leg higher in the dollar. It could also shift investors towards value stocks like financials. On the flip side, lower core numbers especially, could see high quality growth stocks continue their upward march. But inflation is still well above the Fed’s target of 2% and will still involve policy tightening by the Fed into year end. A 75bp hike is now given a 70% chance.
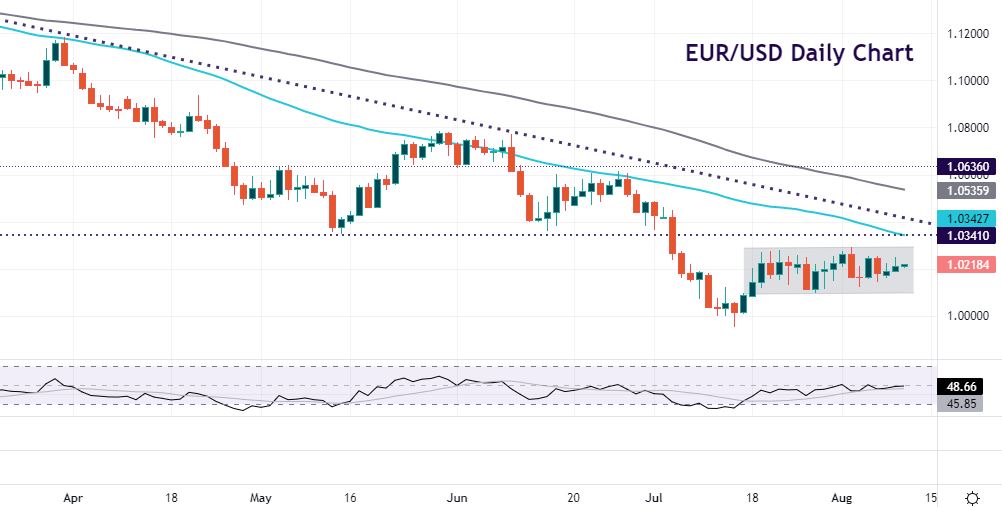
Chart of the Day – EUR/USD continues to range trade
It’s been classic ‘summer market’ trading in the world’s most popular currency pair. We’ve been stuck in a range between 1.01 and 1.03 for 15 sessions now. Moody’s recent downgrade of Italy’s sovereign outlook didn’t trouble those levels. The September elections in Italy may prove a headwind. The energy crisis drags on as we head out of summer and into grim predictions about the winter months. A new catalyst is needed to shake the pair out of its slumber.
Short term support is 1.0135 and then 1.0096. Resistance is 1.0285 and the top of the range at 1.0293. The January 2017 high is 1.0341 where trendline resistance and the 50-day SMA lurk. Parity beckons if we break to the downside. The longer we consolidate, the sharper the breakout move should be.
The information has been prepared as of the date published and is subject to change thereafter. The information is provided for educational purposes only and doesn't take into account your personal objectives, financial circumstances, or needs. It does not constitute investment advice. We encourage you to seek independent advice if necessary. The information has not been prepared in accordance with legal requirements designed to promote the independence of investment research. No representation or warranty is given as to the accuracy or completeness of any information contained within. This material may contain historical or past performance figures and should not be relied on. Furthermore estimates, forward-looking statements, and forecasts cannot be guaranteed. The information on this site and the products and services offered are not intended for distribution to any person in any country or jurisdiction where such distribution or use would be contrary to local law or regulation.
