Market steady on “Turnaround Tuesday” after manic Monday

Headlines
* Wall Street rebound gains steam as Dow rallies 500 points
* Dollar recovers ground, yen steadies as currency market frenzy eases
* US 10-year Treasury yield bounces back after hitting lowest level in over a year
* Kamala Harris taps Walz as running mate in rust belt play
FX: USD found some buyers after the aggressive selling kicked off by Friday’s weak jobs NFP data. Prices are trading bang on support around 102.87. That’s a major Fib level (61.8%) of this year’s move. Markets are pricing out some of the stock sell-off-induced Fed easing, which got above 125bps for 2024 and is now down to 107bps. But a softer dollar is expected by most going forward, especially against pro-cyclicals FX as stability returns.
EUR pulled back to 1.0903 before trading near the recent tops in July and back in March. Short-term rate differentials have narrowed substantially in recent weeks, supporting the single currency.
GBP dipped to lows last seen at the start of July. The 100-day SMA is at 1.2688 with the 200-day SMA at 1.2651. The midpoint of the April to July move is 1.2669. July construction PMI data was the strongest in over two years. Rioting across the UK may not be helping sentiment too much.
USD/JPY steadied somewhat after five huge days of selling. That took the major through the key level of 152 and the 200-day SMA, now at 151.51. The 50% retracement level of the 2023 low to recent high is at 144.58. The yen was the underperformer even with Japan wage metrics overnight rising at the fastest pace since 1997.
AUD moved higher after the huge spike lower on Monday. The RBA left rates unchanged but kept its hawkish tone as expected. USD/CAD fell for a second day after the “blow off” top at 1.3946 during Monday’s turmoil. Failure here with a lower close of the day could mean a major technical reversal.
US Stocks: US markets clawed back some of Monday’s losses though stocks sold off into the close. The benchmark S&P 500 closed 1.04% higher at 5,240. The tech-heavy Nasdaq 100 finished up by 1.02% at 18,078. The Dow Jones settled 0.76% higher at 38,998. The VIX, Wall Street’s fear gauge, fell back to 27. All sectors were in the green with real estate and financials leading the gains. Megacap tech added 1%+ while Caterpillar added 3% as the best performer on the Dow. Its earnings unexpectedly rose year over year while revenue fell.
Asian stock futures are mixed. Asian stocks mostly bounced back with attention focused on Japan. The ASX 200 moved north but was relatively muted as it eyed up the RBA meeting, which held few surprises. The Nikkei 225 rebounded aggressively, up over 10%. This came as the yen reversed some of its recent gains as the carnage in yen-based global carry trades was easing. Monday saw the biggest single one-day sell-off since Blcak Monday in 1987. The Hang Seng and Shanghai Composite lagged with the former giving up initial gains.
Gold struggled for a second day as yields and the dollar attempted to rebound. Gold could be making a double top reversal pattern with the neckline around $2356. A break of this could see prices fall to over $100.
Market thoughts – Markets still wary of more tantrums
The summer market momentum crash that kicked off the week has served up all sorts of reasons and excuses for the price action. We mentioned the perfect storm yesterday to hit the Nikkei with summer liquidity and disappointing US jobs data adding fuel to the red screens on Monday. But certainly it is the BoJ’s hawkish pivot and unravelling of the carry trade which has caused volatility. And it could continue into the weeks and months ahead.
Analysts at various investment banks reckon we may be only half way through the unwind of the $500bn trade. Just to recap, investors borrow cheap yen and put the cash into higher-yielding assets elsewhere, like US stocks. But as the yen strengthened and borrowing costs rose, investors taking advantage of the carry trade then received margin calls, sparking a wave of selling around the world. Volatility might also persist due to seasonal softness that typically is seen peaking in the S&P 500 in September. The dollar could see some buyers emerge after Treasury yields spiked too low and are due a bounce. That might support the buck in the short-term, but Fed policy easing ahead might be a headwind to prolonged gains.
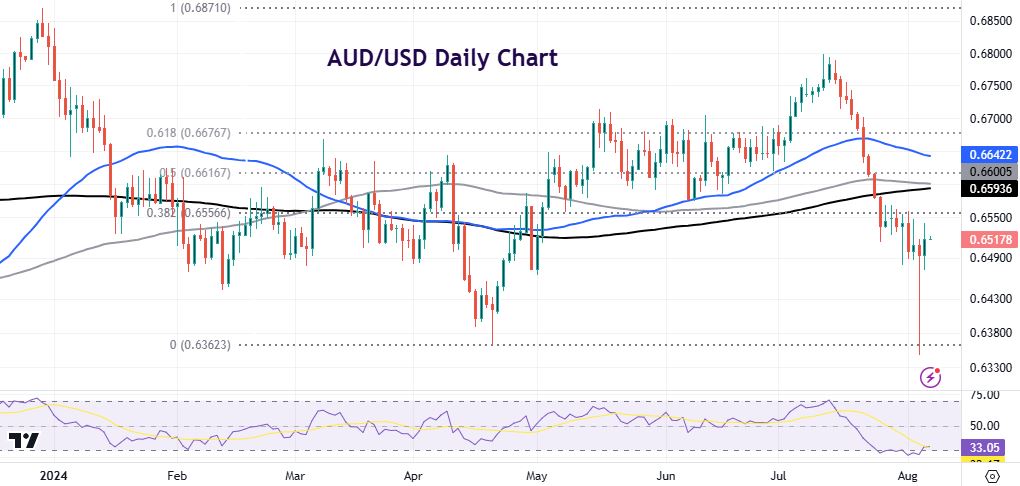
Chart of the Day – AUD/USD spike could be signal to turn higher
Technical analysis is always especially useful when price action is highly volatile, and the markets are hunting upside and downside major technical levels. The selling seen on Monday in AUD/USD around the European open was severe and tapped the year-to-date and April important low at 0.6362. Sure enough, the major rebounded sharply through the day after that. But prices need to get above 0.6556 and likely 0.6616 to see more upside.
On the fundamental side, there is a clear disconnect between Governor Bullock’s assessment of inflation risks and the market’s continued optimism for rate cuts by year end. Money markets have priced in above an 80% chance of a 25bp rate reduction by the December meeting. Is that a hangover from the market turmoil of the last few days? If so, and Govenor Bullock is more correct rather than markets, AUD could rally into the autumn and year end.
The information has been prepared as of the date published and is subject to change thereafter. The information is provided for educational purposes only and doesn't take into account your personal objectives, financial circumstances, or needs. It does not constitute investment advice. We encourage you to seek independent advice if necessary. The information has not been prepared in accordance with legal requirements designed to promote the independence of investment research. No representation or warranty is given as to the accuracy or completeness of any information contained within. This material may contain historical or past performance figures and should not be relied on. Furthermore estimates, forward-looking statements, and forecasts cannot be guaranteed. The information on this site and the products and services offered are not intended for distribution to any person in any country or jurisdiction where such distribution or use would be contrary to local law or regulation.
