Stocks slip, the Vix sinks, yen jumps higher

Overnight Headlines
*US stocks rallied for a sixth day just shy of all-time highs
*USD dipped further, particularly against commodity currencies
*Vix drops again near to year lows
*US 10-year Treasury yields hit a seven-month high at 1.673%
US equities closed a mixed bag. The Dow retook its record high amid solid earnings. The S&P500 closed with a sixth straight positive session, just 0.2% below its record high. The tech-heavy Nasdaq closed marginally lower. Implied volatility has moved down throughout the week. Asian markets are softer this morning while US futures are signalling a negative open.
USD remains on the defensive with support at 93.50 being threatened again today. Rate-sensitive, pro-cyclical currencies continued to outperform. AUD traded above 0.75, the highest since the start of July. CAD tested this week’s lows at 1.2310. Gains for EUR and GBP were more modest. Both are battling with resistance at 1.1663/5 and just above 1.38 respectively. Dollar selling is also now being seen in USD/JPY after making new highs at 114.69.
Market Thoughts – Dollar reversal continues
The greenback is on its seventh down day and counting this morning. The risk mood has generally picked up this week with bonds selling off and stocks rebounding. Commodities are taking a breather with oil just off multi-year highs.
That said, bonds selling off means yields are going up with US Treasuries pushing to multi-month highs. Ordinarily that should see dollar support and we look for more consolidation in the short run. The Fed is the key here and is edging towards swift tapering. After that the timing of rate hikes is up for debate but will come much earlier than most other major central banks. This reduced, global USD liquidity should in time be supportive of the dollar.
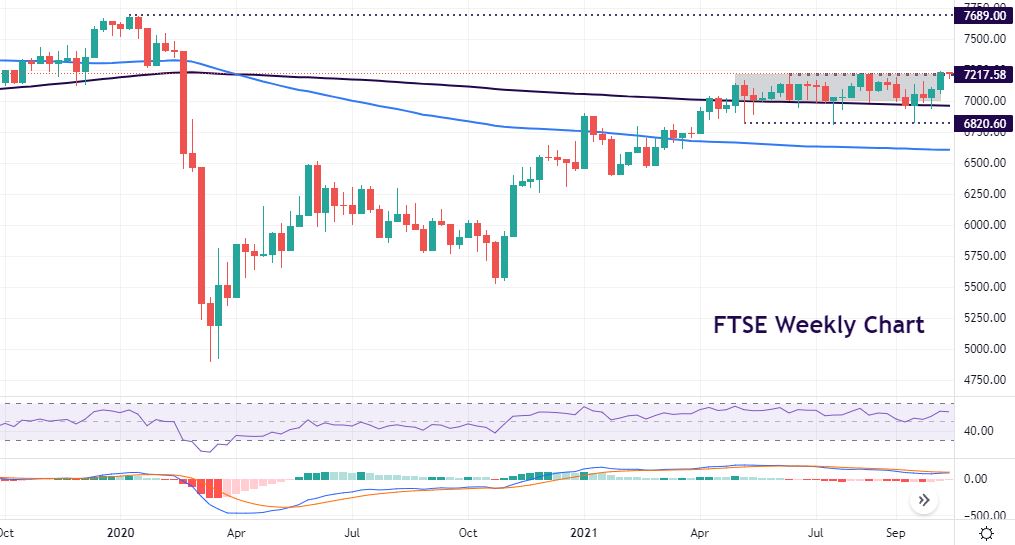
Chart of the Day – FTSE100 hits resistance
The weekly FTSE100 chart shows how the rapid ascent from the November lows last year slowed over the summer. After prices eventually broke through the 100-week SMA, the index has traded between the 7,000-7,220 levels. The 200-week SMA is now acting as initial support with prices dipping below this to lows around 6,813/28.
But resistance is firm at current prices around 7,220. We have hit this area several times since June and retraced. A flag looks to be forming on the daily chart which is a continuation pattern. Upside levels if we do break should come quickly and include 7,403 and 7,500. But bullish momentum is waning slightly so resistance may prove tough to decisively break again.
The information has been prepared as of the date published and is subject to change thereafter. The information is provided for educational purposes only and doesn't take into account your personal objectives, financial circumstances, or needs. It does not constitute investment advice. We encourage you to seek independent advice if necessary. The information has not been prepared in accordance with legal requirements designed to promote the independence of investment research. No representation or warranty is given as to the accuracy or completeness of any information contained within. This material may contain historical or past performance figures and should not be relied on. Furthermore estimates, forward-looking statements, and forecasts cannot be guaranteed. The information on this site and the products and services offered are not intended for distribution to any person in any country or jurisdiction where such distribution or use would be contrary to local law or regulation.
