Dollar up in 16 of the last 18 sessions on weak stocks

* Bank of Canada slashes rates and welcomes return to low inflation
* ECB officials split on need for jumbo cuts as growth concerns take over
* US stocks slump as surging Treasury yields undermine risk sentiment
* Tesla jumps after Q3 profit margin beats estimates
FX: USD extended gains with several majors breaking down through key levels. Yields continue to go north which is crushing the yen. The dollar is benefitting from what markets perceive to be a potential Trump win. That would bolster expectations of higher global tariffs and generous tax cuts which would lift inflation and boost growth, underpinning firmer yields and so the greenback. The next target for bulls is 104.79.
EUR continued lower though pared some losses, with eyes on the 78.6% retracement level of the year-to-date low to high at 1.0732. European stagnation and worse has contrasted sharply with recent US data. Money markets have increased pricing to around 35bps of cuts for the December ECB meeting. The US curve has reined in those bets in recent weeks. Commentary from most ECB officials have been supportive of a series of rate moves.
GBP looks to be breaking lower after trying to cling on to the support zone around 1.30. Market price in two 25bps rate cuts more or less next month and in December. The 100-day SMA is at 1.2962. BOE Governor Bailey said services inflation still has to fall further.
USD/JPY burst higher breaking through the 200-day SMA at 151.35 and the previous intervention level just below 152. The yen slump is both a function of higher USD yields and domestic political risk premium ahead of the weekend’s election. The lack of verbal intervention by Japanese authorities so far has probably meant speculative sellers’ confidence is increasing. If the MoF remains quiet, the market will continue to test the Japanese authorities. The next upside level is 153.40.
AUD looks to be moving decisively lower as it nears the 200-day SMA at 0.6627. USD/CAD spiked higher to 1.3862 on the announcement of the 50bps rate cut by the BoC which had been priced in. It was the first cut of this size in 15 years outside of the pandemic and increased the amount of easing since June to 125bp. Markets are betting on another big cut in December as Governor Macklem made clear there would be further easing if the economy evolves as the bank thinks.
US Stocks fell relatively sharply with tech leading the losses. The S&P 500 closed 0.92% lower to settle at 5,797. The tech-heavy Nasdaq 100 lost 1.55% to finish at 20066. The Dow settled down 0.96% at 42,514. Consumer discretionary and tech saw the steepest declines, with only utilities and real estate in the green. Boeing reported a large quarterly loss and McDonald’s faced pressure after an e.coli breakout, closing over 5% down. Telsa reported improved earnings, up 8% from a year ago. The stock was up nearly 5% after hours.
Asian stocks: Futures are lower. Asian stocks were mixed with rising yields and ongoing geopolitical tensions. The ASX 200 was rangebound with tech lower and consumer stock higher. The Nikkei 225 dipped below the 200-day SMA and closer to 38,000. Concerns are growing about US yields and the upcoming weekend Japan elections. The Hang Seng and Shanghai Composite outperformed with the former gaining over 1% led by strong auto stocks following strong local IPO activity.
Gold sold off over 1.2% printing an outside day. That is where the day’s range from high to low is bigger than yesterday’s and can be a bearish signal. The uptrend could be losing momentum, and a reversal might be imminent. An intraday record top was seen at $2758.
Day Ahead – PMIs to inform central bank decisions
Eurozone PMIs will be under the spotlight after they signalled more weakness and declining price pressures in the economy last time. That prompted a back-to-back rate cut by the ECB last week, and going forward potentially a series of meeting-by-meeting moves. Even hawks on the Governing Council haven’t pushed back against this over the last few days. The bank is focused now on growth so this will be an important lead indicator. US manufacturing also disappointed last time though the services figure remained at robust levels, alleviating slowdown and recession fears. Solid US growth contrasts with stagnation in Europe, and more of the same will keep pressure on EUR/USD.
Markets have zeroed in on another bout of US economic exceptionalism (though we are wary of the latest front cover of The Economist as the ultimate contrarian indicator). Traditionally, following an initial rate cut, market expectations for further reductions increase. However, this time there has been a pricing out of about 50bp of cuts until March. The rising likelihood of a Trump victory also continues to support yields and the greenback.
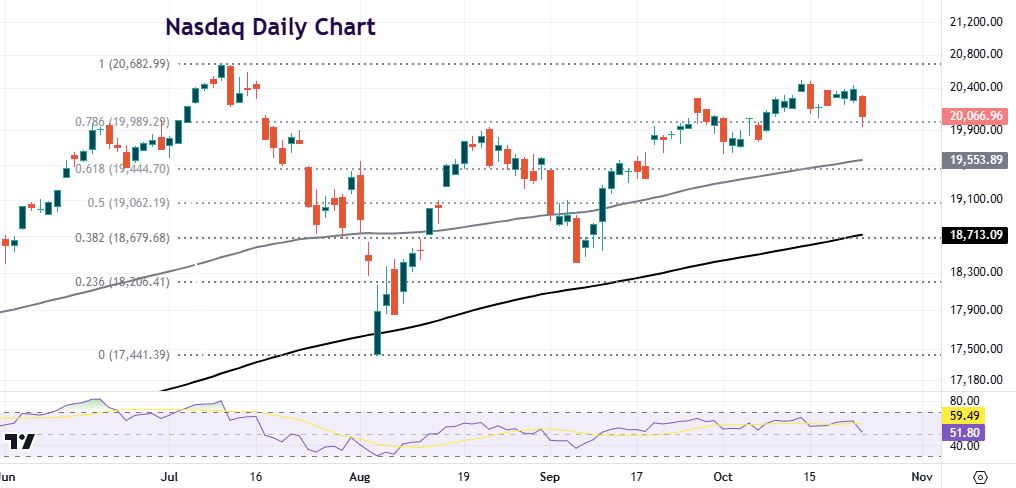
Chart of the Day – Nasdaq 100 hits resistance
Megacap tech stocks had dominated the US stock indices gains for some time, which fuelled long-held concerns about an increasingly lop-sided rally. But in recent months, we’ve seen a more broad-based earnings recovery and a Fed easing cycle kick off with a jumbo-sized rate cut. That has seen the tech-laden Nasdaq lag the other US markets as cheaper, more cyclical companies have been snapped up by price sensitive investors.
The index hasn’t quite recovered all of its losses from the record high set in July. Prices look to have moved decisively above a minor Fibonacci retracement level (78.6%) of the summer sell-off at 19,989. But last week’s top is 20,493 which resides just below the all-time peak at 20,682 is proving tough resistance. We get a slew of megacap tech earnings coming soon with Meta, Microsoft, Apple and Amazon all reporting on Wednesday and Thursday next week.
The information has been prepared as of the date published and is subject to change thereafter. The information is provided for educational purposes only and doesn't take into account your personal objectives, financial circumstances, or needs. It does not constitute investment advice. We encourage you to seek independent advice if necessary. The information has not been prepared in accordance with legal requirements designed to promote the independence of investment research. No representation or warranty is given as to the accuracy or completeness of any information contained within. This material may contain historical or past performance figures and should not be relied on. Furthermore estimates, forward-looking statements, and forecasts cannot be guaranteed. The information on this site and the products and services offered are not intended for distribution to any person in any country or jurisdiction where such distribution or use would be contrary to local law or regulation.
