Bond yields in focus as markets awaits FOMC decision

Headlines
*US Treasury two-year yields climb relentlessly toward 4% before Fed
*Japanese consumer inflation hits near eight-year high ahead of BoJ
*US dollar firm as markets brace for another big Fed rate increase
*US equity futures rise after Wall Street snaps two day losing streak
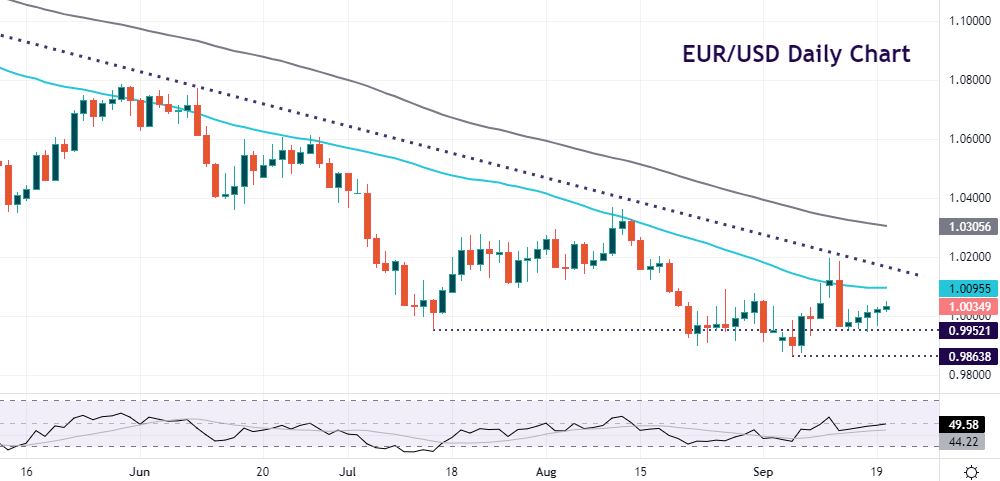
USD traded mixed with the DXY closing nears its lows at 109.73. EUR continues to trade above key support at 0.9952 and the psychological parity level. GBP dropped to 1.1355 before closing above 1.14 at 1.1430. USD/JPY tracked sideways ending the day at 143.21. AUD dipped to 0.6672 before ending higher at 0.6727. NZD closed lower by nearly 0.5% at 0.5960. USD/CAD spiked to 1.3344 before closing at 1.3250, above key support at 1.3223.
US equities kicked off the week in volatile trade swinging between gains and losses. They eventually closed in positive territory with the broad S&P500 finishing 0.69% higher. The tech-laden Nasdaq gained 0.77% and the Dow 0.64%. Asian stocks followed the improved risk appetite Stateside. But advances were capped ahead of this week’s risk events. US and European futures are indicative of a slightly higher open.
Market Thoughts – US Treasury yields hit highs
Seasoned traders often say the bond market leads other markets. Well, yields on US government debt reached the highest levels in over a decade yesterday. This comes ahead of the Fed meeting tomorrow with markets braced for a third straight jumbo 0.75% rate hike. Odds for a mega-hike of 1% hover around 18-20%.
The yield on the 10-year US Treasury is seen as a benchmark for global borrowing costs. That pushed above 3.5% for the first time since April 2011. The two-year yield rose to a 15-year high at 3.94%. This yield tracks expectations for interest rates more closely. But crucially, all yields across the curve ie. longer duration yields have rocketed higher. This is because markets now expect a longer period of higher borrowing costs in the coming months. This may continue to weigh on stocks and particularly growth stocks.
Chart of the Day – EUR/USD holding above key support
The big recent driver for the euro has been European natural gas prices. They dropped for a third week in a row through last Friday. This trend continued on Monday too and potentially eases price pressures going forward as the region stocks up on alternative energy sources ahead of winter. ECB messaging remains hawkish with various policymakers keen to take determined action to curb inflation in October and beyond.
EUR/USD is consolidating after last week’s failure at 1.02 and the long-term bearish trendline. The mid-July low at 0.9952 continues to act as strong support. The 50-day SMA at 1.0095 is initial resistance. A move through the 1.02 area is needed to slow the weak bias.

The information has been prepared as of the date published and is subject to change thereafter. The information is provided for educational purposes only and doesn't take into account your personal objectives, financial circumstances, or needs. It does not constitute investment advice. We encourage you to seek independent advice if necessary. The information has not been prepared in accordance with legal requirements designed to promote the independence of investment research. No representation or warranty is given as to the accuracy or completeness of any information contained within. This material may contain historical or past performance figures and should not be relied on. Furthermore estimates, forward-looking statements, and forecasts cannot be guaranteed. The information on this site and the products and services offered are not intended for distribution to any person in any country or jurisdiction where such distribution or use would be contrary to local law or regulation.
