Fibonacci retracement is a widely-used technical analysis tool that helps traders identify potential support and resistance levels in the financial markets.
Whether you are trading forex or stocks, understanding how to apply Fibonacci retracement can potentially improve your trading strategy by providing clear entry and exit points, managing trading risk, and predicting market reversals through technical analysis.
Key Points
- Fibonacci Retracement helps traders predict market support and resistance levels using a sequence discovered by Leonardo Fibonacci in 1202, applicable across various financial markets.
- The tool guides traders in identifying entry and exit points, profit targets, and potential reversal zones, offering a systematic approach to trading.
- Case studies demonstrate its practical use in real trades, showcasing how it aids in making informed trading decisions, from planning to execution.
What is Fibonacci Retracement?
A well-known technical analysis tool that many traders use to navigate the erratic markets, Fibonacci Retracement is used to study future potential support and resistance levels based on previous price movement.
What is the Fibonacci Sequence?
The Fibonacci Sequence is a series of numbers where each number is the sum of the two preceding ones, starting with 0 and 1. This sequence is significant because it reveals the Golden Ratio (1.618), a mathematical relationship that appears frequently in nature, architecture, and financial markets.
Traders use this ratio and the related retracement levels in technical analysis to forecast potential market movements. The Fibonacci Sequence helps identify patterns in market trends, making it a valuable tool for predicting key support and resistance levels, thus aiding traders in making informed decisions.
Fibonacci’s Golden Ratio
Fibonacci’s Golden Ratio, approximately 1.618, is a mathematical constant found throughout nature, art, and financial markets. This ratio is derived from the Fibonacci Sequence, where the ratio of consecutive numbers approaches 1.618 as the sequence progresses.
In trading, this ratio plays a crucial role in identifying potential reversal points or continuation patterns. Fibonacci retracement levels, such as 61.8%, are closely tied to the Golden Ratio and are used by traders to forecast key support and resistance areas in price movements.
Fibonacci Retracement Levels Explained
Apart from the famous Fibonacci Retracement, there are many other tools that serve as extensions such as Trend-based Fibonacci Extension, Fibonacci Channel, Fibonacci Time Zone etc.
However, the primary focus would be on the retracement. The application of the Fibonacci Retracement can be applied to many financial instruments on CFDs including the foreign exchange market, stock market, and even the Cryptocurrency market.
Within the financial markets, by taking two extreme points on a swing trend, the tool divides the area in between, which serves as an area of interest for traders to consider a trade. Furthermore, it also provides insight to possible levels of take profit or levels where markets may reverse.
| Fibonacci Retracement Levels | Usage |
| 0%, 100% | For bullish markets, 100% represents the low while 0% represents the high. For bearish markets, 100% represents the highs while 0% represents the low. |
| 23.6%, 38.2%, 50% | Shallow levels of retracement. Generally, it’s not recommended to enter a trade. |
| 61.8%, 78.6% | Deep levels of retracement. Generally, it’s favorable to enter a trade as it provides for better risk to reward ratio. |
| -27%, -68% | Take profit targets 1 & 2, after a successful retracement. |
| 127.2%. 161.8% | Reversal levels 1 & 2, if final retracement level (78.6%) does not hold. |
In trading, Fibonacci retracement levels are derived by dividing the vertical distance between two extreme points on a price chart (usually a swing high and swing low). These levels are used by traders:
- Identify key levels: Traders use key levels to identify where the market price might experience a pullback or continuation.
- Plan entry and exit points: Traders use Fibonacci levels to time their trades, entering at a retracement and exiting near an extension.
- Predict market reversals: If the price hits a retracement level, it often signals a potential reversal or continuation of the current trend.
- Manage risk: By identifying strategic points to enter a trade, Fibonacci retracement improves the risk-to-reward ratio for traders.
How Fibonacci Retracements Works in Trading
Fibonacci retracement is a key tool used by traders to analyse potential turning points in market trends. It operates by measuring the distance between two extreme points—typically the highest high and the lowest low of a trend—and dividing that distance by the key Fibonacci levels (23.6%, 38.2%, 50%, 61.8%, and 78.6%).
Identifying Potential Reversal Points
Fibonacci retracement levels are commonly used to spot potential areas where the market might reverse its direction. When a price pulls back from a recent high or low, traders often look to the key Fibonacci levels (especially 38.2%, 50%, and 61.8%) as potential reversal zones.
If the price retraces to one of these levels and shows signs of weakening, traders may interpret this as an opportunity to enter a trade in the direction of the original trend, anticipating a rebound or continuation.
Setting Stop-Loss and Take-Profit Levels
Fibonacci retracement levels are also useful for setting stop-loss and take-profit orders. For example, a trader might place a stop-loss just beyond the 61.8% retracement level to protect against a deeper pullback while aiming for a take-profit at a negative Fibonacci extension level like -27% or -68%.
These levels help traders maintain a favourable risk-to-reward ratio by identifying precise points for limiting potential losses and locking in potential profits, thus improving overall trade risk management and decision-making.
Fibonacci Retracement Trading Strategies
Just through the Fibonacci Retracement tool alone, a trader can determine four key points; determining the trend (0% & 100%), areas of entry (23.6% to 78.6%), multiple areas to secure profits (-27% & -68%), areas that market would reverse if the main bias does not hold (127.2% & 161.8%) [4].
This essentially enforces structure in every trade, which in turn can help to eliminate human errors.
Combining Fibonacci with Other Indicators
While Fibonacci retracement is a powerful tool on its own, combining it with other technical indicators can significantly enhance a trader’s strategy.
Popular indicators such as moving averages, Relative Strength Index (RSI), and trendlines can confirm Fibonacci levels, offering more robust signals for entry and exit points. For example, when a Fibonacci retracement level aligns with a moving average or an oversold/overbought signal from RSI, it increases the likelihood of a successful trade.
This combination helps traders filter out false signals and improve the accuracy of their trading predictions, providing a more comprehensive view of market conditions.
Risk Management Considerations
Effective risk management is crucial when using Fibonacci retracement in trading. Although Fibonacci levels provide potential support and resistance areas, traders should always combine them with solid risk management practices.
Setting appropriate stop-loss levels just below or above key Fibonacci retracement points (like 61.8% or 78.6%) can help minimise losses in case the market moves against the trade. Additionally, using Fibonacci levels to set realistic take-profit targets ensures traders secure gains without overexposing themselves to unnecessary risks.
Fibonacci Trading: How to Trade Using Fibonacci Retracement
Through the various case studies discussed below, it will highlight the proper usage of the Fibonacci retracement tool from planning to execution, and to exit strategy. The case studies will touch on both buy and sell examples on different CFDs on currency pairs to show the versatility of this tool.
The examples below are used for educational purposes only. Past performance is not an indication of future results and any reliance on such is at your own risk.
Case Study 1 – Fibonacci Retracement Buy Application
Case study 1 shows a buy trade on XAUUSD using the Fibonacci retracement tool.
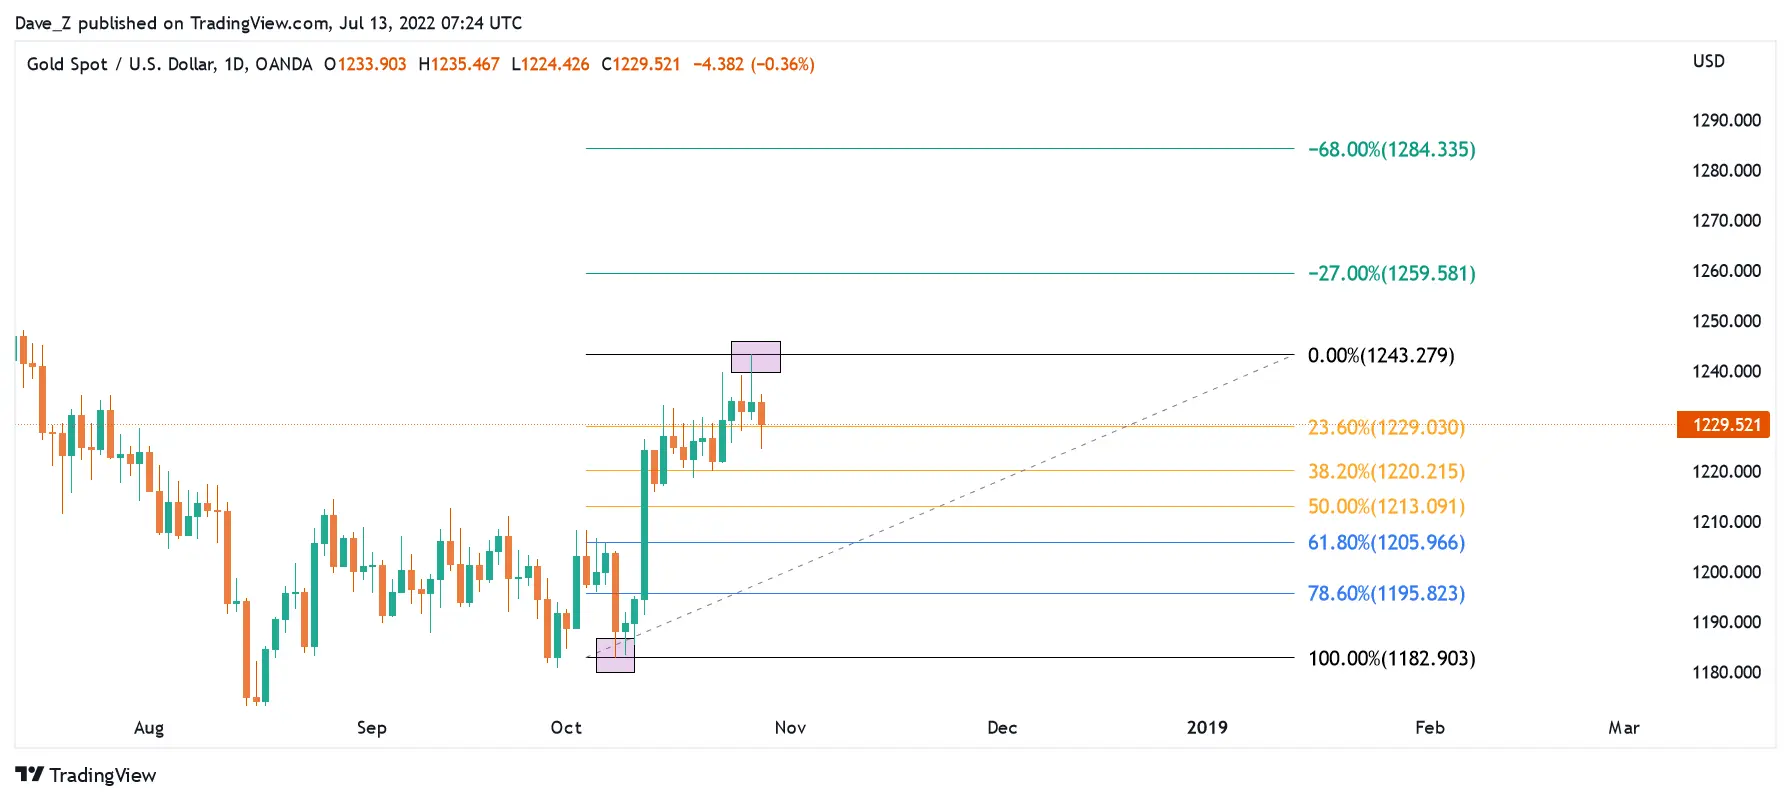
Assuming a bullish bias, figure 1 shows an identification of a swing low to swing high on gold using the Fibonacci Retracement tool as indicated by the purple boxes.
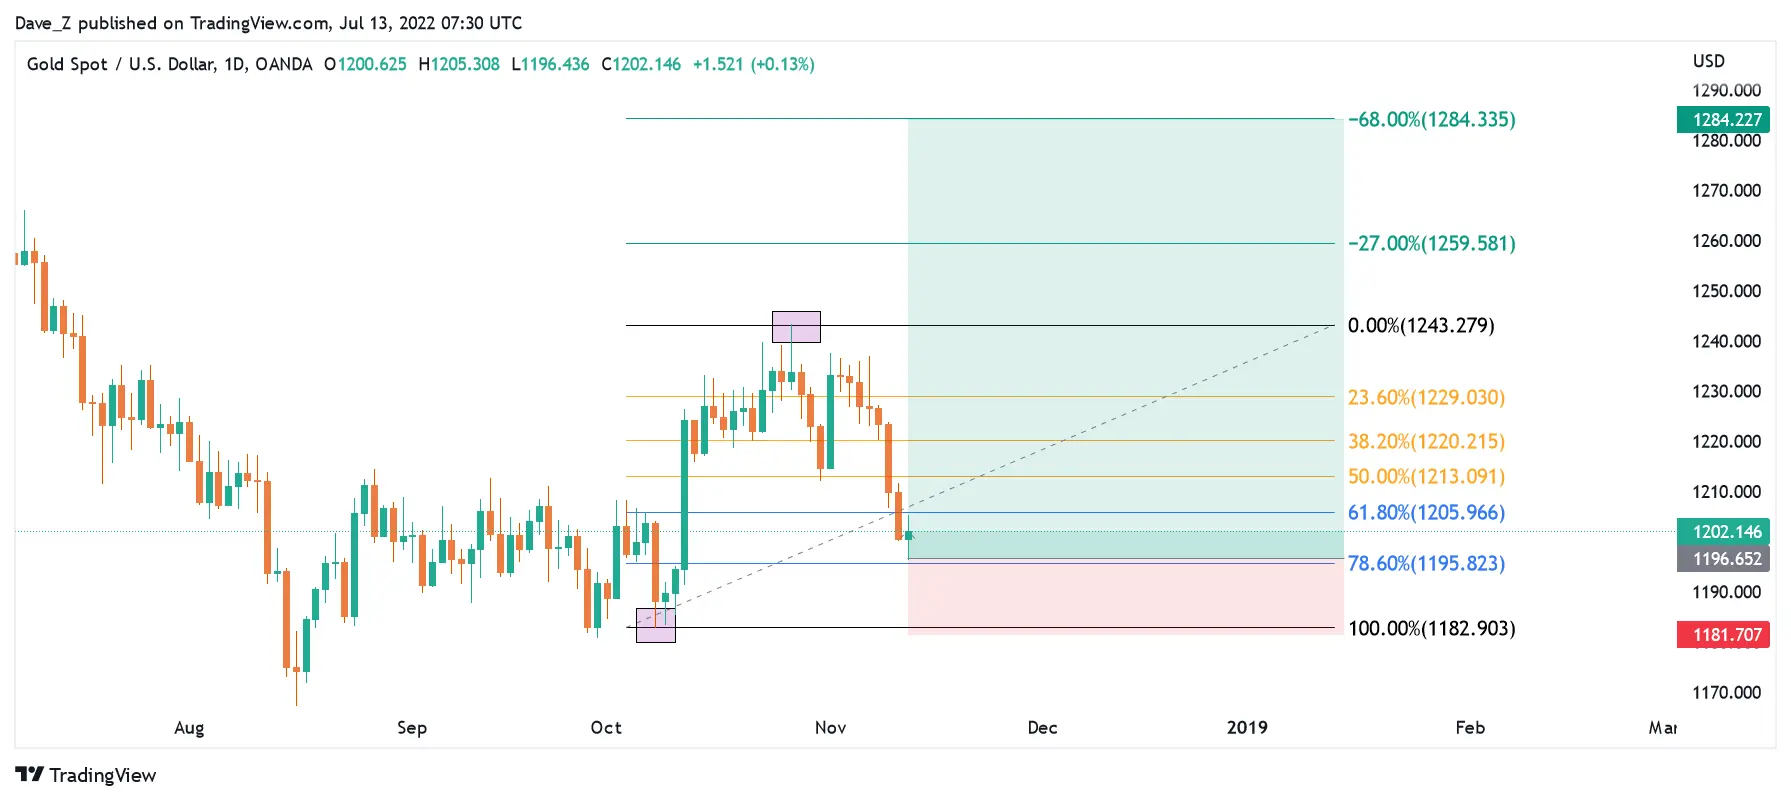
In figure 2, gold markets retraced to 78.6% Fibonacci Retracement level which signifies a possible buy trade idea. A general rule of thumb is placing the stop loss one Fibonacci level below the entry, in this case, below the 100% level. The take profit level used would be the -68% level, giving this trade a potential risk to reward ratio of 1:5.8.
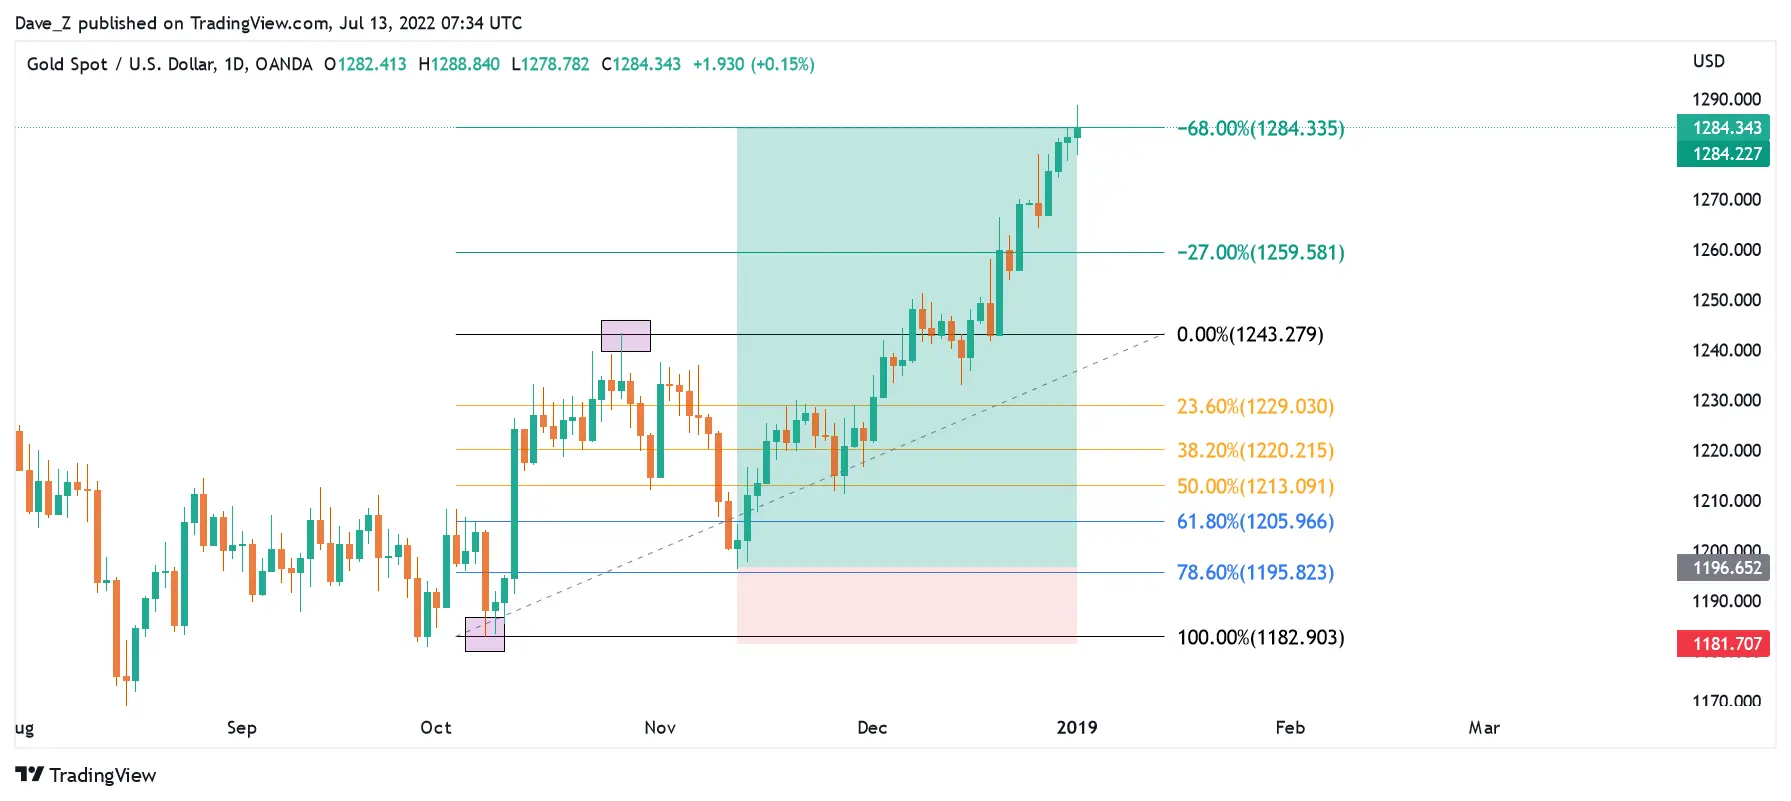
Figure 3 shows the gold trade hitting take profit targets 1 and 2, further highlighting how the tool structures a trade from start to end.
Case Study 2 – Fibonacci Retracement Sell Application
Case study 2 shows a sell trade on AUDUSD using the Fibonacci retracement tool.
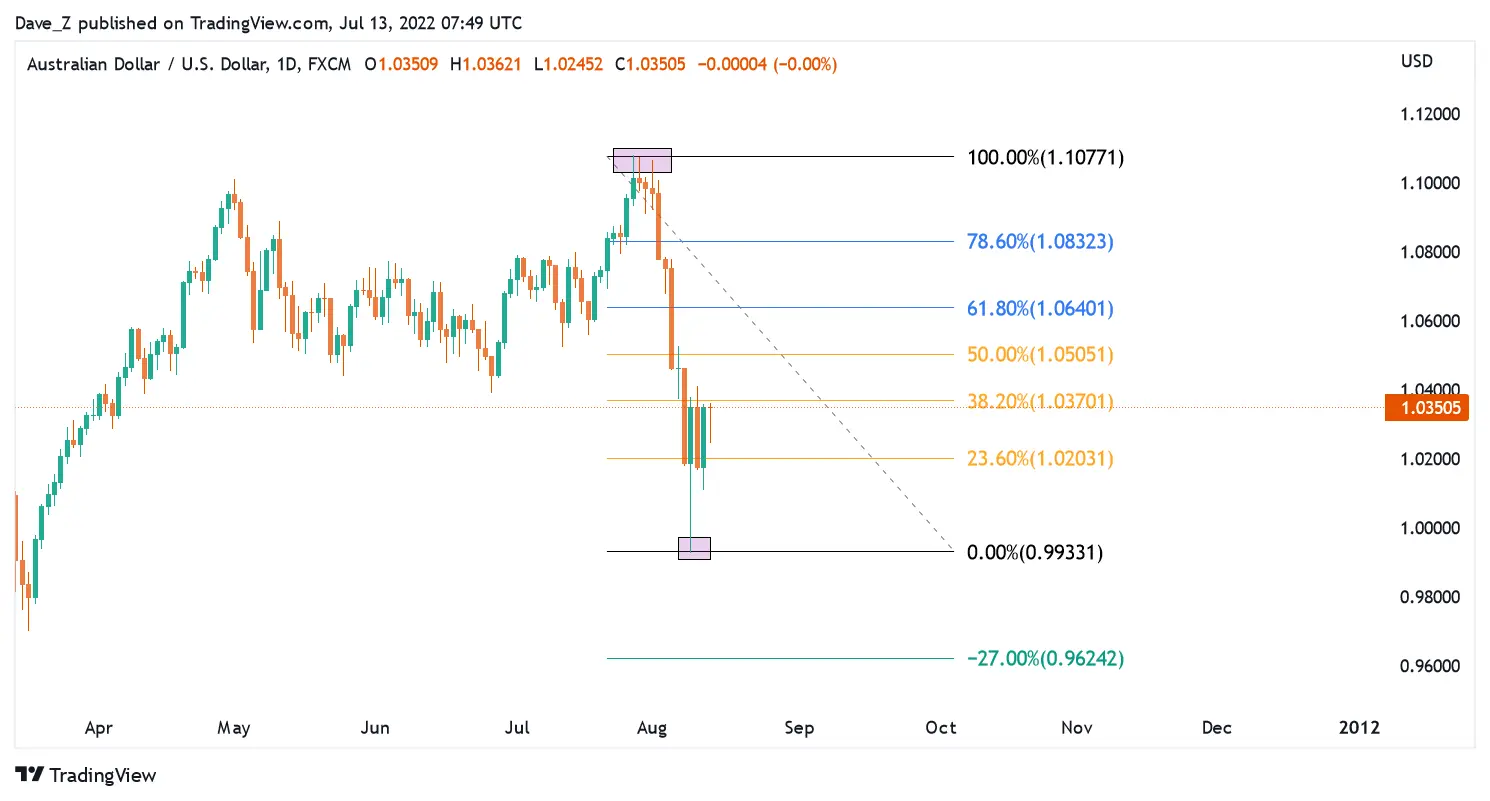
Assuming a bearish market, figure 4 shows AUDUSD with the application of the Fibonacci retracement from a high to a low, indicated by the purple boxes.
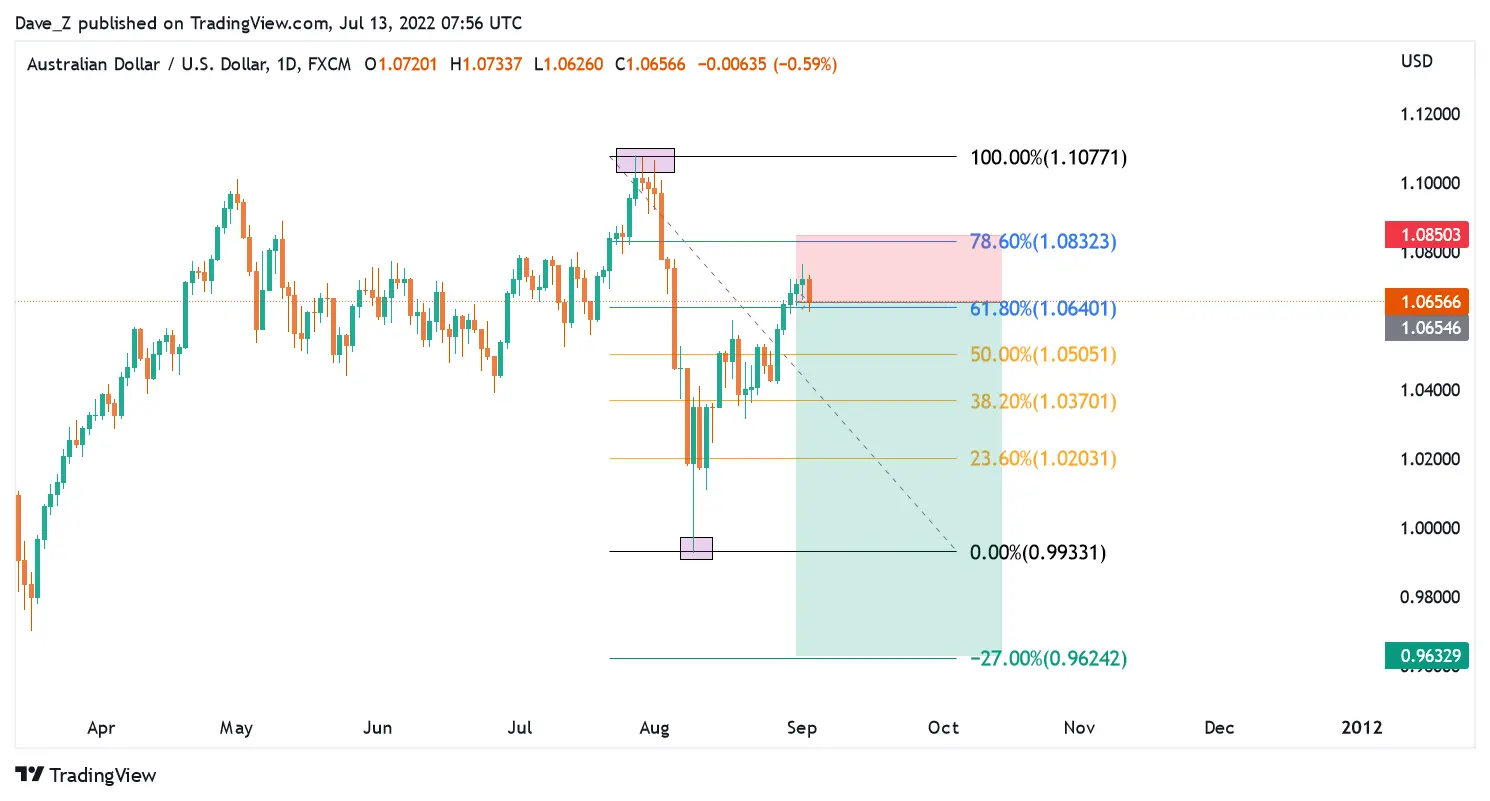
In figure 5, AUDUSD can be seen retracing into the 61.8% level, giving rise to a possible sell trade idea with stop loss one level above the entry (78.6%) and take profit level at -27%. The potential risk to reward for this trade would be 1:5.2.
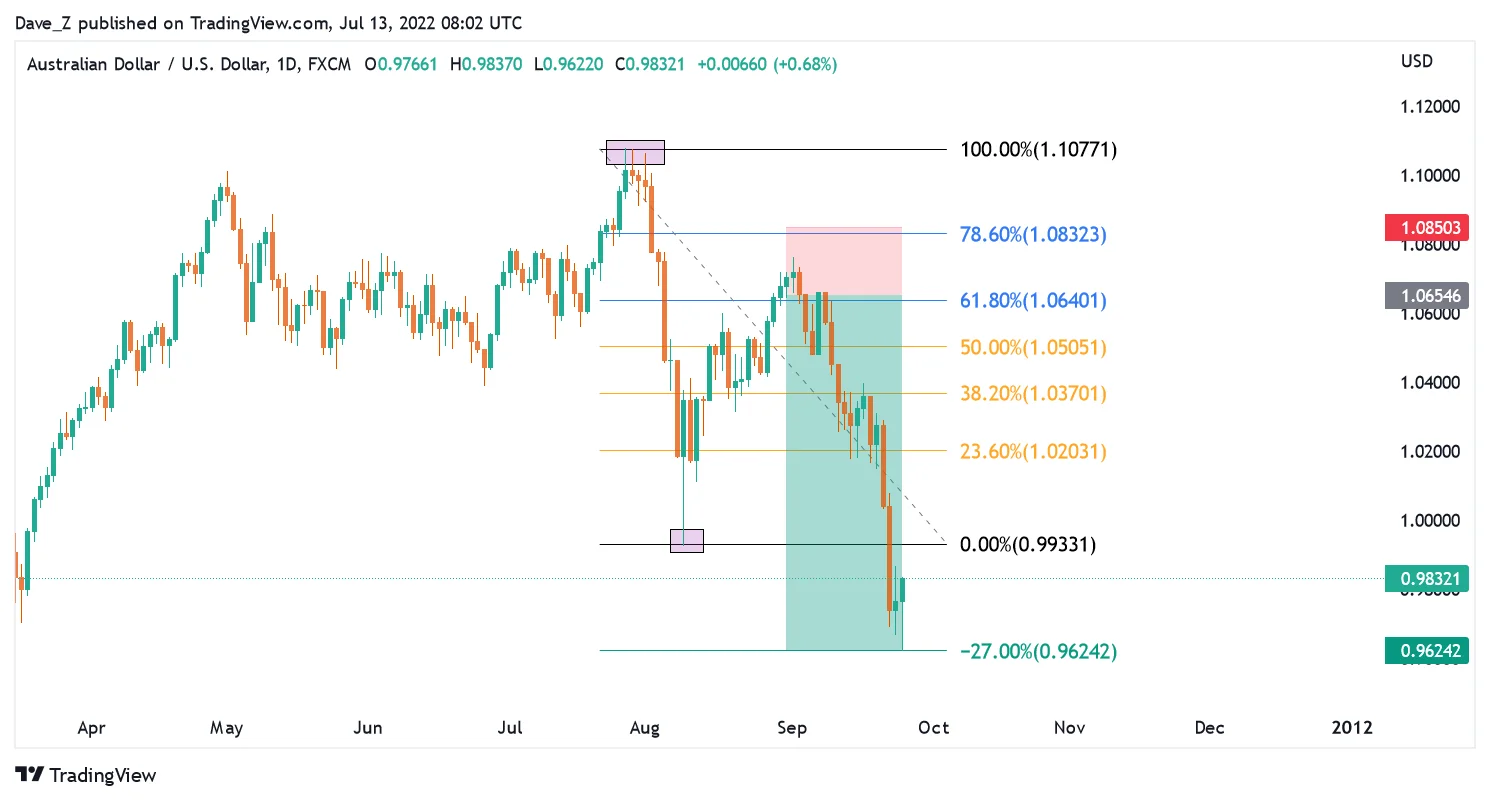
A completed AUD/USD sell idea in figure 6 with markets hitting Take profit 1 level, emphasising the trade scaffolding that the Fibonacci Retracement has to offer.
Case Study 3 – Fibonacci Retracement Reversal Levels
At times when the trader’s bias is wrong (bullish bias but bearish market), reversal levels serve to help the adaptive individual to change market conditions. Case study 3 shows the effective use of Fibonacci’s reversal levels on GBPUSD, switching from a buy to a sell bias.
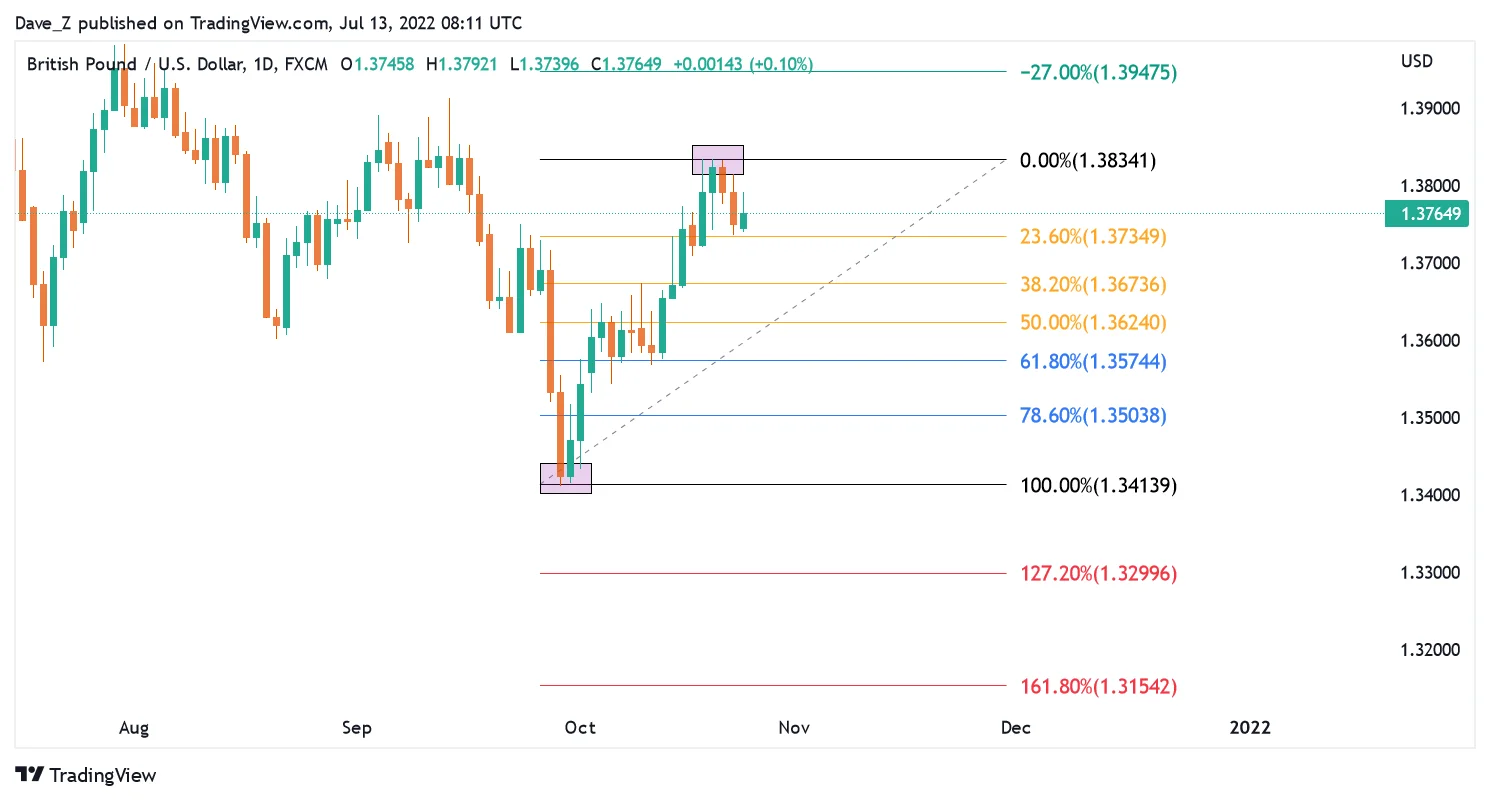
Note in figure 7, the Fibonacci Retracement is applied with the intent of a GBPUSD buy trade idea, from a swing low to a swing high.
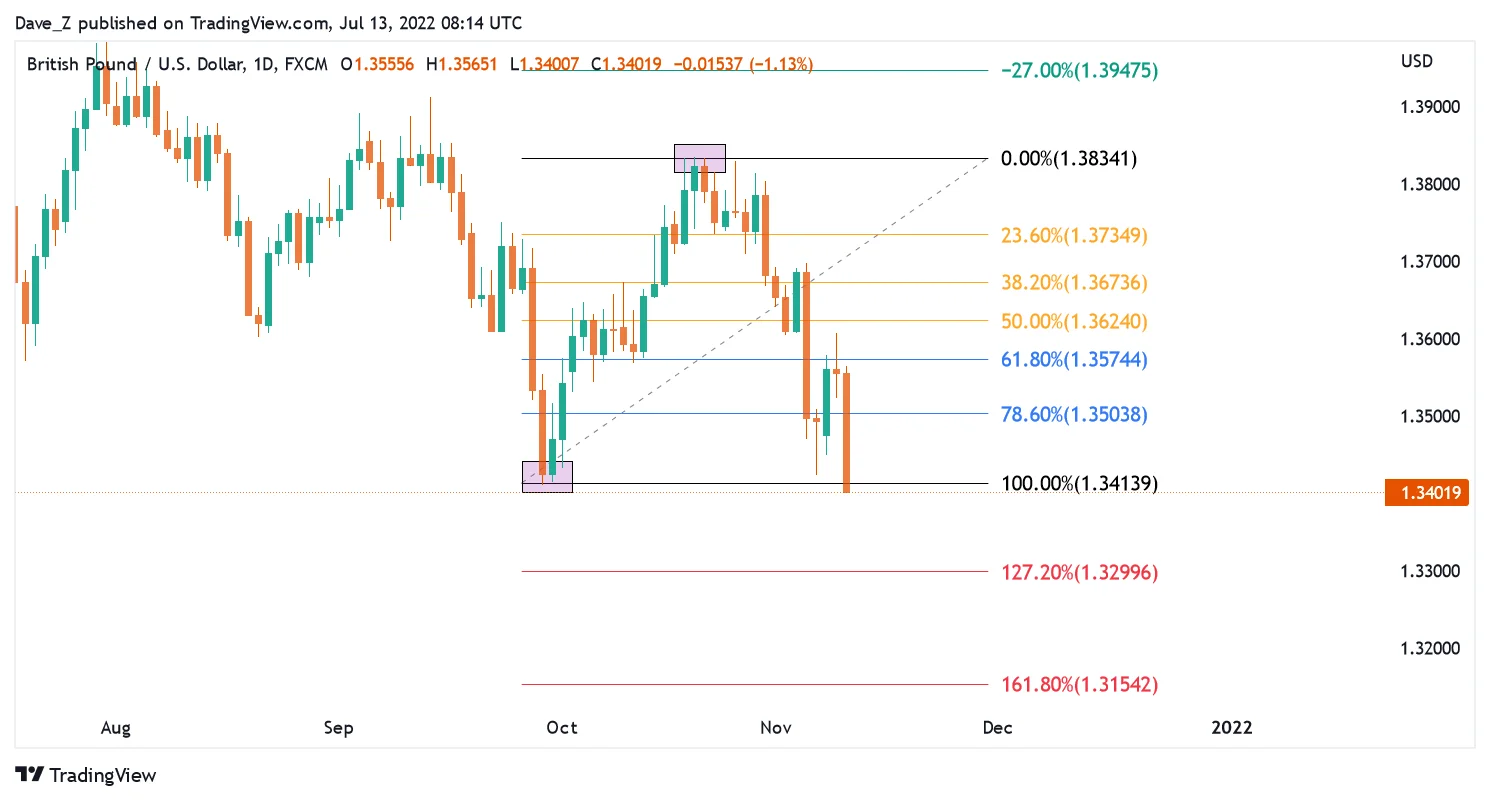
In figure 8, the retracement levels do not seem to hold any weight and GBPUSD markets have broken below the 100% level.
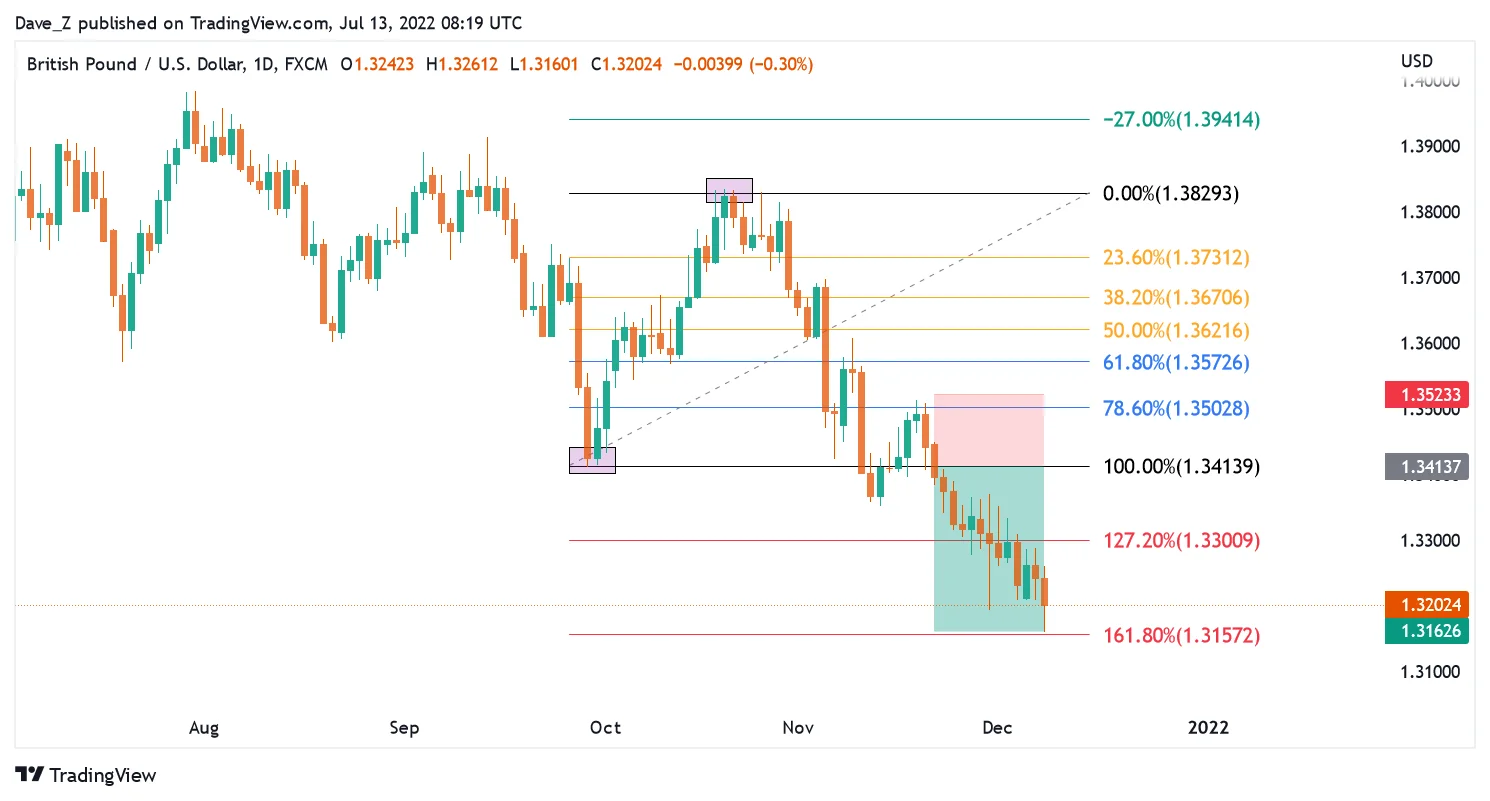
Figure 9 showcases an adaptive sell trade idea below the 100% level when the areas of entries do not hold weight, targeting reversal levels 1 & 2, generating a risk to reward ratio of 1:2.3.
Fibonacci Retracement in Popular Trading Platforms
The Fibonacci Retracement tool is not limited to just the mentioned platforms. However, here’s how you can find the Fibonacci Retracement tool on the following platforms.
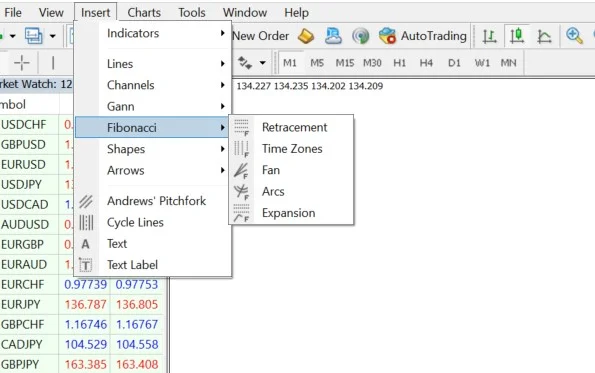
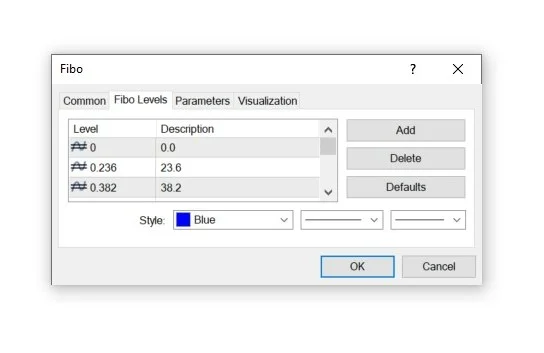
Using Fibonacci Tools in MetaTrader 4/5
MT 4/5 – Insert > Fibonacci > Retracement
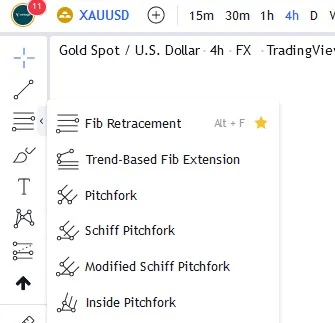
Fibonacci Retracements on TradingView
TradingView – Left toolbar > Fib Retracement
Conclusion
The practical application of the Fibonacci Retracement serves as a scaffolding for every trade from entry points to take profit, and reversal levels. Traders should consider the availability of numerous tools. Nevertheless, the Fibonacci Retracement is an amazing tool to have in one’s trading arsenal.
Unlock the power of Fibonacci retracement in your trading strategy today. Open a live account with Vantage and start making more informed trading decisions.
You can also sign up for our free, weekly webinars that will break down the current markets as well as discuss potential trade set ups for the week.
References
- “Fibonacci – Britannica”. https://www.britannica.com/biography/Fibonacci. Accessed 22 July 2022.
- “Fibonacci Retracements – Stock Charts”. https://school.stockcharts.com/doku.php?id=chart_analysis:fibonacci_retracemen. Accessed 22 July 2022.
- “USING FIBONACCI EXTENSIONS TO PLACE ACCURATE TAKE-PROFIT ORDERS – Forex Academy”. https://www.forex.academy/67-using-fibonacci-extensions-to-place-accurate-take-profit-orders/. Accessed 22 July 2022.
- “Strategies for Trading Fibonacci Retracements – Investopedia”. https://www.investopedia.com/articles/active-trading/091114/strategies-trading-fibonacci-retracements.asp. Accessed 22 July 2022.
The information has been prepared as of the date published and is subject to change thereafter. The information is provided for educational purposes only and doesn't take into account your personal objectives, financial circumstances, or needs. It does not constitute investment advice. We encourage you to seek independent advice if necessary. The information has not been prepared in accordance with legal requirements designed to promote the independence of investment research. No representation or warranty is given as to the accuracy or completeness of any information contained within. This material may contain historical or past performance figures and should not be relied on. Furthermore estimates, forward-looking statements, and forecasts cannot be guaranteed. The information on this site and the products and services offered are not intended for distribution to any person in any country or jurisdiction where such distribution or use would be contrary to local law or regulation.